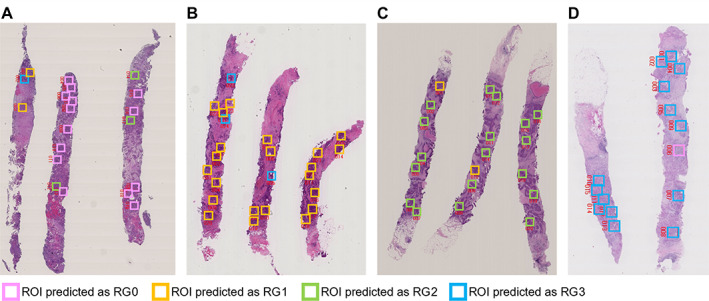
Figure 4.

Results of SVM prediction on representative cases. (A) Case #41 is predicted as RG0 by SVM model. Fourteen ROIs are predicted as RG0 among all 15 ROIs selected in the cancer areas, and their average likelihood score is 0.48, which is higher than other RG groups. (B) Case #83 is predicted as RG1 by SVM model. Twenty ROIs are predicted as RG1 among all 26 ROIs selected in the cancer areas, and their average likelihood score is 0.72, which is higher than other RG groups. (C) Case #10 is predicted as RG2 by SVM model. Eighteen ROIs are predicted as RG2 among all 21 ROIs selected in the cancer areas, and their average likelihood score is 0.82, which is higher than other RG groups. (D) Case #65 is predicted as RG3 by SVM model. Fourteen ROIs are predicted as RG3 among all 18 ROIs selected in the cancer areas, and their average likelihood score is 0.78, which is higher than other RG groups. The details of the SVM analysis result of these cases are shown in supplementary material, Table S10. The red numbers near the ROIs indicate the location of the ROIs.
