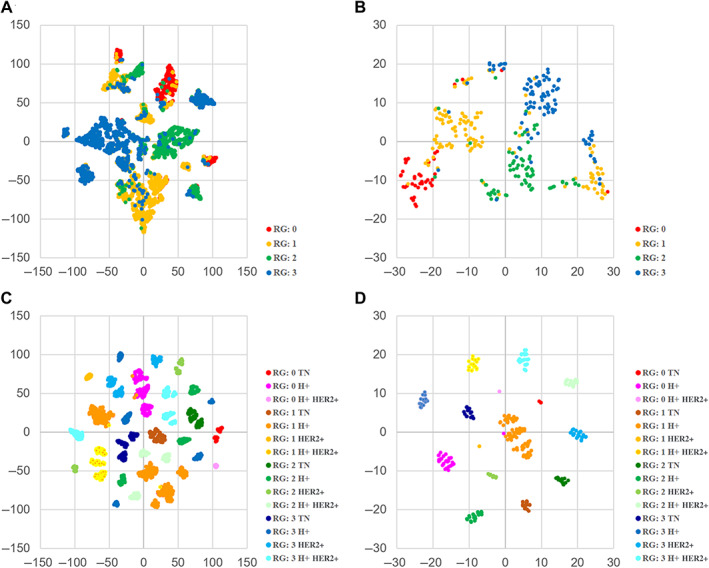
Figure 5.

t‐SNE analysis of SVM likelihood score. Two‐dimensional map visualization by t‐SNE to confirm the prediction accuracy of the classification results of training cases. (A) The visualization is based on the prediction result of all cancer region ROIs. SVM prediction model used RG information only. (B) The visualization is based on the prediction result of each case. SVM prediction model used RG information only. (C) The visualization is based on the prediction result of all cancer region ROIs. SVM prediction model used RG and subtype information. (D) The visualization is based on the prediction result of each case. SVM prediction model used RG information and subtype information.
