
Figure 4.
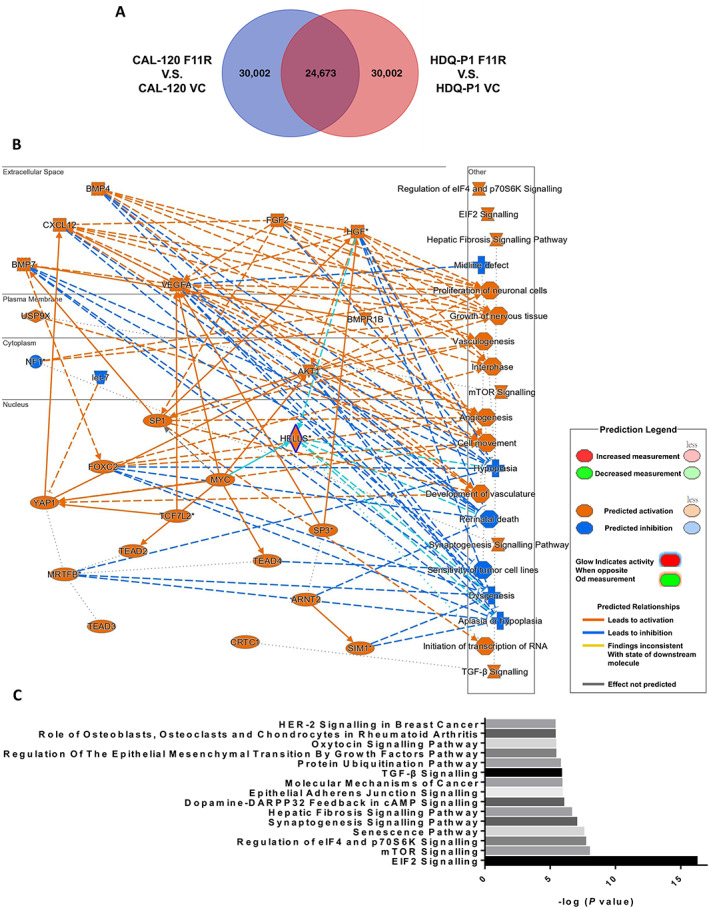
Prediction of molecular biological events using F11R‐based transcriptomics in TNBC cells. (A) Venn diagram of significant changes in targets following microarray analysis of the F11R overexpression model in CAL120 and HDQ‐P1 cells. (B) Networks identified by IPA of F11R‐overexpressing cell models of BCa cells. (C) Potential signalling pathways predicted using IPA that may be affected by F11R overexpression. Data were analysed using IPA software.