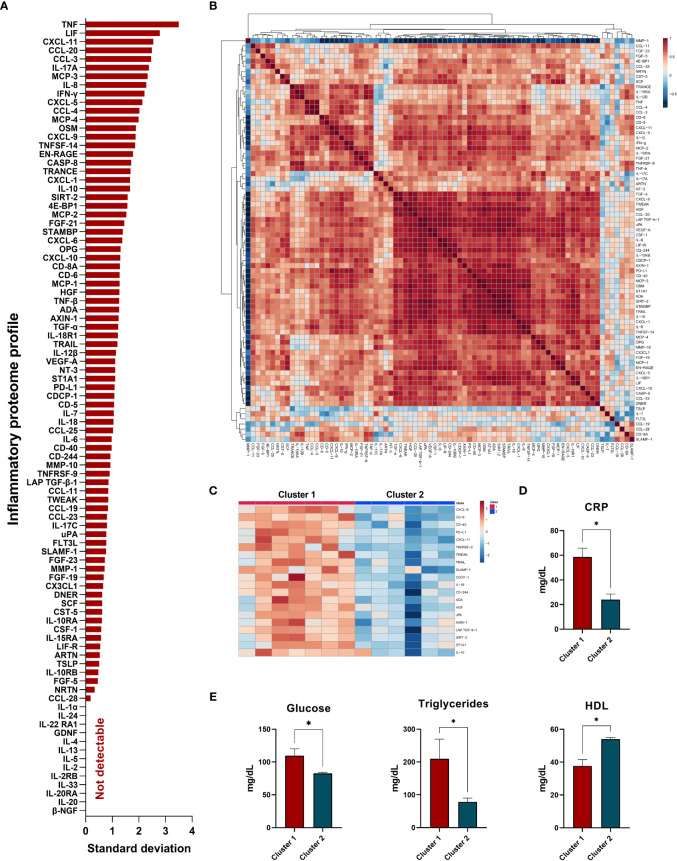
Figure 1.
Inflammatory proteome profile in synovial fluid from PsA patients: cluster analysis and association studies with clinical parameters. (A) Standard deviation of proteins detected in synovial fluid. (B) Heatmap correlation of detected proteins. (C) Heatmap of top inflammatory proteins which differentiate PsA clusters. (D) Levels of C-reactive protein (CRP) among clusters. (E) Levels of glucose, triglycerides, and high-density lipoprotein (HDL)-cholesterol among clusters. *Significant differences between cluster 1 vs cluster 2 (p<0.05).

