
Figure 1.
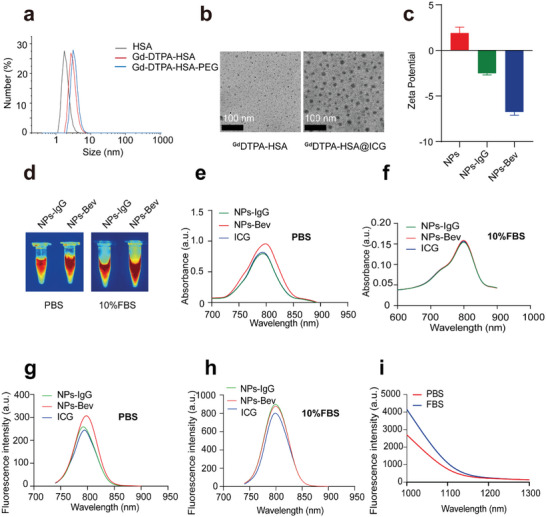
Characterization of NPs‐Bev and NPs‐IgG. a) Mass spectrometry analysis of HSA, Gd–DTPA–HSA, Gd–DTPA–HSA−PEG. b) TEM images showing GdDTPA–HSA (left) and GdDTPA–HSA@ICG (right). Scale bar = 100 nm. c) The zeta potentials of NPs, NPs‐IgG, and NPs‐Bev. d) Representative NIR‐II fluorescence image showing NPs‐IgG and NPs‐Bev in PBS or 10% FBS e,f) The absorption spectra of NPs‐Bev, NPs‐IgG, and ICG in PBS (e) and 10% FBS (f). g,h) Fluorescence emission spectra of NPs‐Bev, NPs‐IgG, and ICG in PBS (g) and 10% FBS (h). i) Fluorescence emission spectra of NPs‐Bev in PBS or 10% FBS under NIR‐II fluorescence excitation (Ex = 808 nm).