
Figure 3.
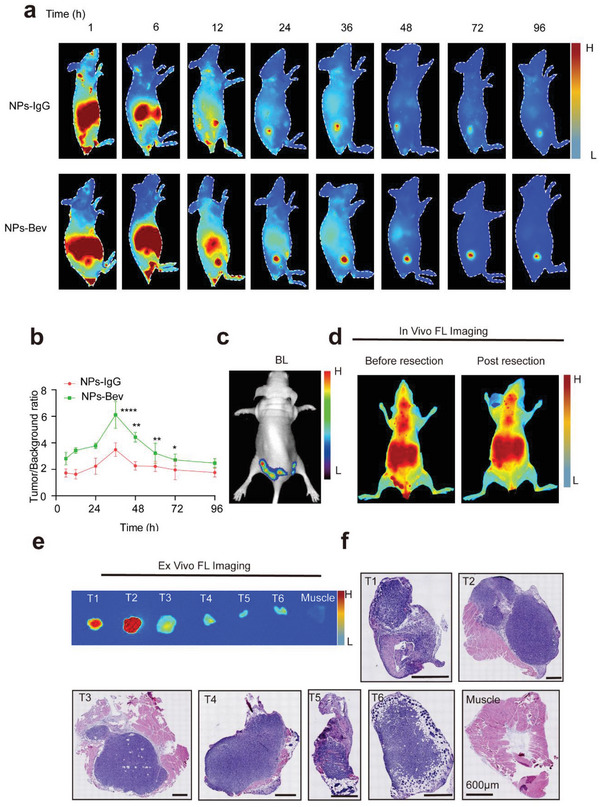
Targeted recognition of tumor and multiple microtumor models in vivo. a) NIR‐II fluorescence imaging in the NPs‐Bev group showed strong fluorescence signals in the tumor at 36 h postinjection. b) The maximum tumor‐to‐background ratio in the group at 36 h postinjection (6.77 ± 0.45) was higher when compared with the NPs‐IgG group at 36 h postinjection (2.48 ± 0.52). c) Preoperative bioluminescent (BL) images at preoperation in a representative multi‐microtumor mouse model. d) NPs‐Bev was injected preoperatively and postoperatively, and fluorescence images taken before and after tumor resection. e) In vitro fluorescence and f) the corresponding H&E‐stained histological images of tumor tissue (T1–T6) and muscle. Scale bar = 600 µm.*p < 0.05, **p < 0.01, ****p < 0.0001.