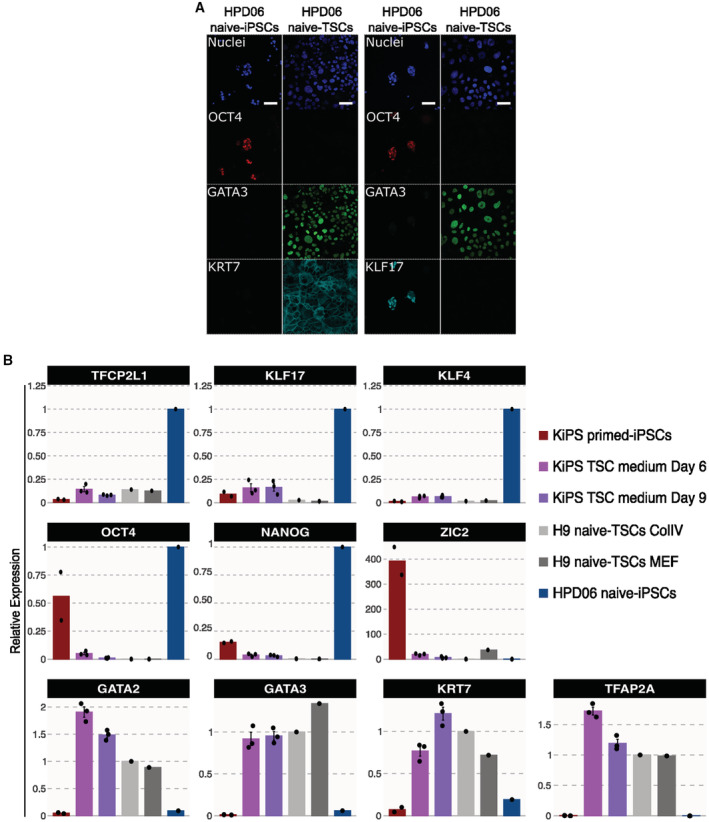
Figure EV1. Characterisation of naive‐TSCs and conversion of conventional PSCs.

-
AImmunostaining for the pluripotency markers OCT4, KLF17 and the TSC markers GATA3 and KRT7 of HPD06 naive‐iPSC and TSC cells derived from naive‐iPSCs (HPD06 naive‐TSCs). Scale bars: 30 μm.
-
BGene expression analysis by RT–qPCR of KiPS primed‐iPSCs, KiPS in TSC medium at day 6 and 9, H9 naive‐TSCs cultured on ColIV or MEF, and HPD06 naive iPSCs.
Data information: (A) Representative images of n = 3 biological replicates are shown. (B) Dots indicate biological replicates, and bars indicate the mean ± SEM of n = 3 biological replicates. Top and middle: naive, primed and general pluripotency markers, expression was normalised to HPD06 naive‐iPSCs; bottom: trophoblast markers, expression was normalised to H9 naive‐TSCs.
