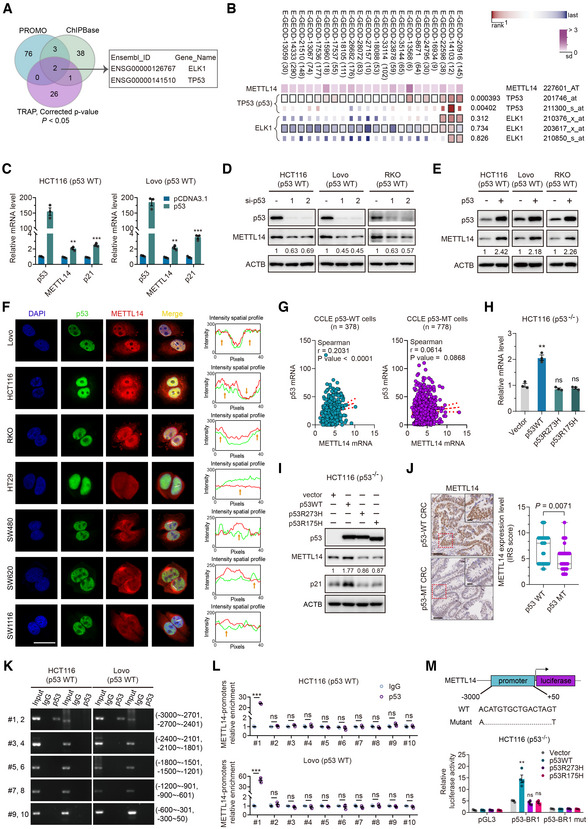
Figure 1. Wild‐type p53 activates METTL14 expression in CRC cell lines.

- Schematic illustration of screening for transcription factors using ChIPBase (http://rna.sysu.edu.cn/chipbase3/index.php), PROMO alggen (http://alggen.lsi.upc.es/cgi‐bin/promo_v3/promo/promoinit.cgi?dirDB=TF_8.3/) and TRAP (http://trap.molgen.mpg.de/).
- MEM (https://biit.cs.ut.ee/mem/) identified correlation between ELK1, p53 and METTL14.
- HCT116 and Lovo cells were transfected with empty vector and p53 plasmid. Forty‐eight hours after transfection, total RNA was then analyzed by qRT–PCR analysis. Data are presented as mean ± SD (biological replicates, n = 3; **P < 0.01, ***P < 0.001).
- HCT116, Lovo, and RKO cells were transfected with control or p53 siRNAs. Forty‐eight hours after transfection, total protein was then analyzed by western blot analysis.
- HCT116, Lovo, and RKO cells were transfected with empty vector and p53 plasmid. Forty‐eight hours after transfection, total protein was then analyzed by western blot analysis.
- Representative immunofluorescence staining of the p53 (green) and METTL14 (red) proteins in p53‐WT HCT116, Lovo, and RKO cells and p53‐MT HT29 (p53R273H), SW480 (p53R273H/P309S), SW620 (p53R273H), and SW1116 (p53A159D) cells. Nuclei were stained with DAPI (blue). Scale bars = 10 μm. The relative mean fluorescence density was analyzed by ImageJ.
- Correlation of METTL14 with p53 mRNA levels in p53‐WT and p53‐MT CRC cell lines from CCLE database (https://sites.broadinstitute.org/ccle). r is the Spearman's rank correlation coefficient.
- qRT–PCR analysis of METTL14 levels after transfection with empty vector, wild‐type, or mutant p53 plasmids in HCT116 (p53−/−) cells (biological replicates, n = 3; **P < 0.01, ns = no significance).
- Western blot analysis of METTL14 levels after transfection with empty vector, wild‐type, or mutant p53 plasmids in HCT116 (p53−/−) cells.
- Representative IHC images, and statistical analysis of immunoreactive score (IRS) of METTL14 expression in p53‐WT (n = 63) and p53‐MT (n = 41) CRC samples. The horizontal lines represent the median; the bottom and top of the boxes represent the 25 and 75% percentiles, respectively; and the vertical bars represent the range of the data. The insets show enlarged images of indicated p53‐WT and p53‐MT CRC tissues, respectively. Scale bars = 20 μm and 2 μm (inset).
- ChIP assay verified the potential p53‐binding site in the METTL14 promoter region in HCT116 and Lovo cell lines. Input fractions and IgG were used as controls.
- ChIP–qRT–PCR assay verified the potential p53‐binding site in the METTL14 promoter region in HCT116 and Lovo cell lines. IgG was used as a control. Data are presented as mean ± SD (biological replicates, n = 3; ***P < 0.001, ns = no significance).
- Luciferase activities of luciferase reporter plasmid containing wild‐type or mutant METTL14 promoter in control, wild‐type p53 or mutant p53‐overexpressing HCT116 (p53−/−) cells. pGL3 and Vector were used as controls. Data are presented as mean ± SD (biological replicates, n = 4; **P < 0.01, ns = no significance).
Data information: For (C, H, L, M), statistical significance was determined by the two‐tailed Student's t‐test. For (J), statistical significance was determined by the nonparametric Mann–Whitney test. β‐actin (ACTB) was used as a loading control, and p21WAF1/Cip1 was used as a positive control. The signal intensities were quantified by densitometry using ImageJ software and normalized to the intensity of the internal positive controls.
Source data are available online for this figure.
