
Figure EV1. Wild‐type p53 activates METTL14 expression in CRC cell lines.
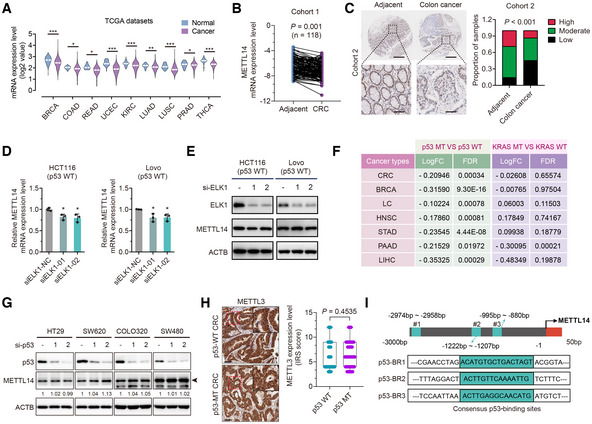
- METTL14 mRNA levels between tumor and normal tissues in the TCGA database (*P < 0.05, **P < 0.01, ***P < 0.001). Breast cancer (BRCA—normal tissues n = 113, cancer tissues n = 1,104); colon cancer (COAD—normal tissues n = 41, cancer tissues n = 471); rectal cancer (READ—normal tissues n = 10, cancer tissues n = 167); endometrioid cancer (UCEC—normal tissues n = 35, cancer tissues n = 548); kidney clear cell carcinoma (KIRC—normal tissues n = 72, cancer tissues n = 535); lung adenocarcinoma (LUAD—normal tissues n = 59, cancer tissues n = 526); lung squamous cell carcinoma (LUSC—normal tissues n = 49, cancer tissues n = 501); prostate cancer (PRAD—normal tissues n = 52, cancer tissues n = 499); and thyroid cancer (THCA—normal tissues n = 58, cancer tissues n = 510).
- qRT–PCR determination of the METTL14 level in CRC and adjacent normal tissues from Cohort 1 (n = 118).
- Representative IHC staining images and statistical analysis of METTL14 in tumor and para‐tumor tissues from Cohort 2 (n = 90). Lower panels show enlarged images of indicated normal or CRC tissues. Scale bars = 200 μm (upper) and 40 μm (lower).
- qRT–PCR analysis of the mRNA levels of METTL14 after transfection with control or ELK1 siRNAs with 48 h treatment in HCT116 and Lovo cells. Data are presented as mean ± SD (biological replicates, n = 3; *P < 0.05).
- Western blot analysis of METTL14 and ELK1 protein levels after transfection with control or ELK1 siRNAs with 48 h treatment in HCT116 and Lovo cells.
- Expression analysis of METTL14 in p53‐WT and p53‐MT or KRAS‐WT and KRAS‐MT tumor tissues from in TCGA. Lung Cancer (LC); Head and Neck Cancer (HNSC); Stomach Cancer (STAD); Liver Cancer (LIHC) and Pancreatic Cancer (PAAD).
- HT29 (p53R273H), SW620 (p53R273H), COLO320 (p53R248W) and SW480 (p53R273H/P309S) cells were transfected with control or p53 siRNAs. Forty‐eight hours after transfection, total protein was then analyzed by western blot analysis. Arrows indicate METTL14 protein.
- Representative IHC images, and statistical analysis of immunoreactive score (IRS) of METTL3 expression in p53‐WT (n = 63) and p53‐MT (n = 41) CRC samples from Cohort 3. The insets show enlarged images of indicated p53‐WT and p53‐MT CRC tissues, respectively. Scale bars = 20 μm and 2 μm (inset). The horizontal lines represent the median; the bottom and top of the boxes represent the 25 and 75% percentiles, respectively, and the vertical bars represent the range of the data.
- Schematic illustration of putative p53‐binding site in METTL14 gene promoter.
Data information: For (A, B, D, and F), statistical significance was determined by a two‐tailed Student's t‐test. For (H), statistical significance was determined by the nonparametric Mann–Whitney test. For (C), statistical significance was determined by the χ2 test. ACTB was used as a loading control.