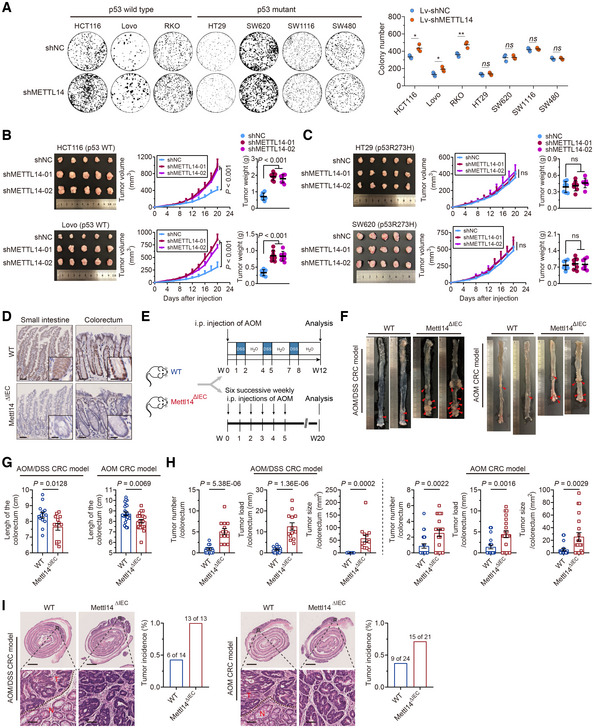
Figure 2. METTL14 inhibits p53‐WT CRC progression.

-
AColony formation assay of p53‐WT (HCT116, Lovo, and RKO) and p53‐MT (HT29, SW620, SW1116, and SW480) cells stably infected with shNC or shMETTL14. Data are presented as mean ± SD (biological replicates, n = 3; *P < 0.05, **P < 0.01, ns = no significance).
-
B, CRepresentative images and analysis of tumors in nude mice bearing stably transfected shNC or shMETTL14 p53‐WT (HCT116 and Lovo) and p53‐MT (HT29 and SW620) cells. Data are presented as mean ± SD (biological replicates, n = 7, ns = no significance).
-
DRepresentative IHC staining images of METTL14 in Mettl14WT and Mettl14ΔIEC mice. The insets show enlarged images of small intestine tissues and colorectal tissues, respectively. Scale bars = 50 μm and 5 μm (inset).
-
ESchematic diagrams of AOM/DSS‐induced and AOM‐induced CRC models. i.p., intraperitoneal.
-
FColorectum was opened longitudinally, and two representative colorectal images derived from METTL14WT and METTL14ΔIEC mice from AOM/DSS‐induced and AOM‐induced CRC models, respectively.
-
GComparison of colorectum length between METTL14WT (n = 14, n = 24) and METTL14ΔIEC (n = 13, n = 21) mice from AOM/DSS‐induced and AOM‐induced CRC models, respectively. Data are expressed as mean ± SD.
-
HComparison of tumor number, tumor load, and tumor size between METTL14WT (n = 14, n = 24) and METTL14ΔIEC (n = 14, n = 24) mice from AOM/DSS‐induced and AOM‐induced CRC models, respectively. Data are expressed as mean ± SD.
-
IRepresentative HE staining images of colorectum in METTL14WT (n = 14, n = 24) and METTL14ΔIEC (n = 13, n = 21) mice from AOM/DSS‐induced and AOM‐induced CRC models. Lower panels show enlarged images of indicated normal or CRC tissues. Scale bars = 2 mm (upper) and 40 μm (lower). Black dashed line refers to the border of tumor (T) and normal (N) tissues. Tumors are classified as adenomas with low to focal high‐grade dysplasia. The percentages of mice with dysplasia are shown (right).
Data information: For (A–C, G, H), statistical significance was determined by a two‐tailed Student's t‐test.
