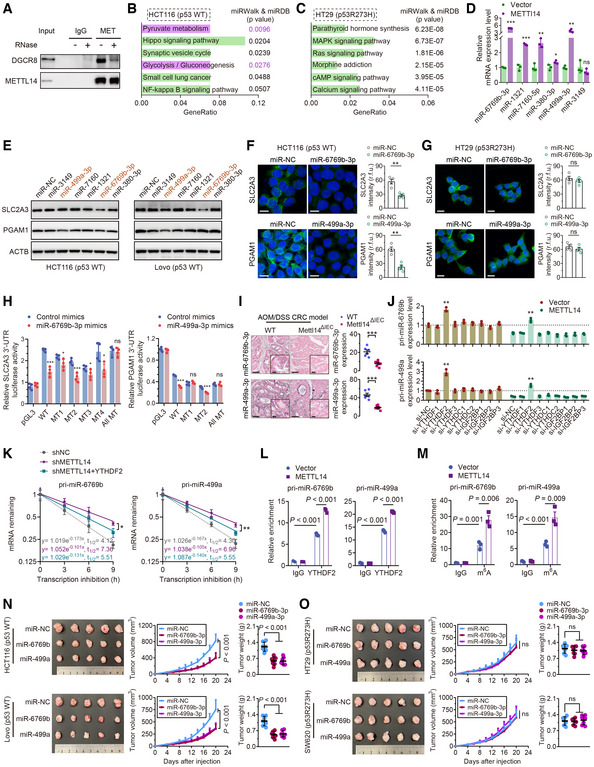
Figure 4. METTL14 decreases SLC2A3 and PGAM1 levels by m6A‐YTHDF2‐mediated pri‐miR‐6769b and pri‐miR‐499a processing.

- Co‐IP of METTL14 and DGCR8 in HCT116 cells in the presence or absence of ribonuclease.
- KEGG enrichment analysis of differential expression of miRNA target genes by miRWalk (http://mirwalk.umm.uni‐heidelberg.de/) and miRDB database (http://mirdb.org/) in p53‐WT HCT116 cells.
- KEGG enrichment analysis of differential expression of miRNA target genes by miRWalk and miRDB database in p53‐MT HT29 cells.
- qRT–PCR analysis of the miRNA levels in stably transfected vector and METTL14 HCT116 (p53‐WT) cells. Data are presented as mean ± SD (biological replicates, n = 3; ns = no significance, *P < 0.05, **P < 0.01, ***P < 0.001).
- Western blot analysis of SLC2A3 and PGAM1 protein levels in HCT116 and Lovo (p53‐WT) cells transfected with control or miRNA mimics.
- Representative IF staining and quantitative analysis of the SLC2A3 (green) and PGAM1 (green) proteins in HCT116 (p53‐WT) cells transfected with control or miRNA mimics. Nuclei were stained with DAPI (blue). Scale bars = 20 μm. Data are presented as mean ± SD (biological replicates, n = 4; **P < 0.01).
- Representative IF staining and quantitative analysis of the SLC2A3 (green) and PGAM1 (green) proteins in HT29 (p53‐MT) cells transfected with control or miRNA mimics. Nuclei were stained with DAPI (blue). Scale bars = 20 μm. Data are presented as mean ± SD (biological replicates, n = 4; ns = no significance).
- Luciferase activity of reporters expressing wild‐type or mutant SLC2A3 and PGAM1 3′UTRs in HCT116 (p53‐WT) cells transfected with control or miRNA (miR‐6769b‐3p and miR‐499a‐3p) mimics. Data are presented as mean ± SD (biological replicates n = 4; ns = no significance, *P < 0.05, ***P < 0.001).
- Representative ISH images and quantitative analysis of miR‐6769b‐3p and miR‐499a‐3p in tumor tissues from AOM/DSS‐induced Mettl14ΔIEC and Mettl14WT mice CRC models. The insets show enlarged images of tumor tissues. Scale bars = 20 μm and 2 μm (inset). Data are presented as mean ± SD (biological replicates, n = 6; ***P < 0.001).
- qRT–PCR analysis of the pri‐miR‐6769b and pri‐miR‐499a levels in stably transfected Lv‐vector and Lv‐METTL14 HCT116 cells with control, YTHDF1‐3, YTHDC1‐2 or IGF2BP1‐3 siRNAs. Data are presented as mean ± SD (biological replicates, n = 3; **P < 0.01). The dotted line represents basal mRNA expression of pri‐miR‐6769b and pri‐miR‐499a in HCT116 cells, acting as a control.
- RNA stability of pri‐miR‐6769b and pri‐miR‐499a in stably transfected shNC and shMETTL14 HCT116 (p53‐WT) cells with or without YTHDF2 overexpression. The data are presented as mean ± SD (biological replicates, n = 3, *P < 0.05, **P < 0.01).
- RIP and qRT–PCR assays detected the enrichment of pri‐miR‐6769b and pri‐miR‐499a to YTHDF2 in stably transfected Lv‐vector and Lv‐METTL14 HCT116 cells. Data are presented as mean ± SD (biological replicates, n = 3).
- MeRIP–qPCR assay detected m6A modification on pri‐miR‐6769b and pri‐miR‐499a in stably transfected vector and METTL14 HCT116 cells. Data are presented as mean ± SD (biological replicates, n = 3).
- Representative images of tumors and analysis in nude mice intervened with control, miR‐6769b‐3p or miR‐499a‐3p expression p53‐WT (HCT116 and Lovo) cells. Data are presented as mean ± SD (biological replicates, n = 7).
- Representative images of tumors and analysis in nude mice intervened with control, miR‐6769b‐3p or miR‐499a‐3p expression p53‐MT (HT29 and SW620) cells. Data are presented as mean ± SD (biological replicates, n = 7, ns, no significance).
Data information: For (D, F–O), statistical significance was determined by a two‐tailed Student's t‐test. ACTB was used as a loading control.
Source data are available online for this figure.
