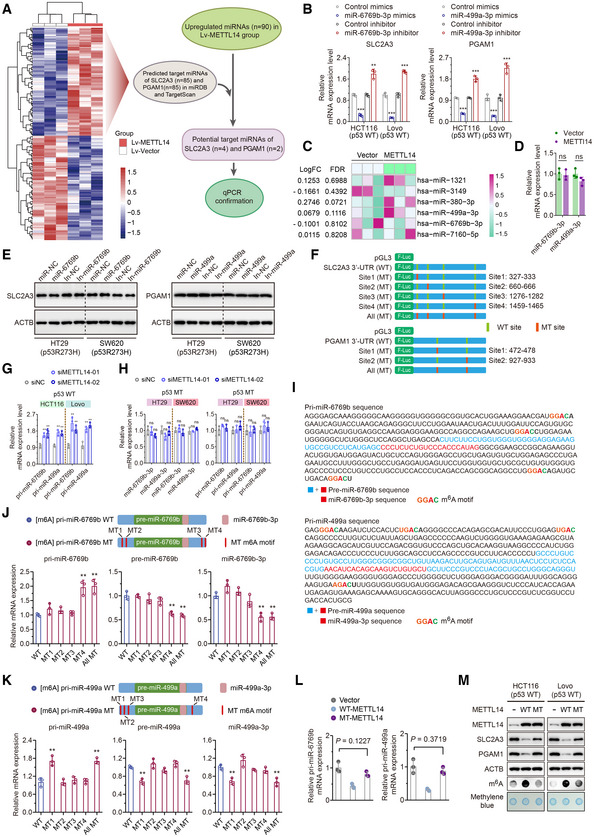
Figure EV4. METTL14 decreases SLC2A3 and PGAM1 levels by m6A‐YTHDF2‐mediated pri‐miR‐6769b and pri‐miR‐499a processing.

- Schematic illustration of the protocol for screening miRNAs that are regulated by METT14 and simultaneously target SLC2A3 and PGAM1 using miRNA Microarray, TargetScan (http://www.targetscan.org/vert_71/) and miRDB (http://mirdb.org/miRDB/) database.
- qRT–PCR analysis of the SLC2A3 and PGAM1 levels in HCT116 and Lovo (p53‐WT) cells transfected with miR‐6769b‐3p and miR‐499a‐3p mimics and corresponding inhibitors. Data are presented as mean ± SD (biological replicates, n = 3; **P < 0.01, ***P < 0.001).
- Heatmap of known METTL14 target miRNAs in p53‐WT cells identified by miRNA microarrays using HT29 cells stably infected with lentivirus carrying METTL14 overexpression or control vector.
- qRT–PCR analysis of the miR‐6769b‐3p and miR‐499a‐3p levels in stably transfected vector and METTL14 HT29 (p53‐MT) cells. Data are presented as mean ± SD (biological replicates, n = 3; ns = no significance).
- Western blot analysis of SLC2A3 and PGAM1 in HT29 and SW620 (p53‐MT) cells transfected with control or miRNA mimics and corresponding inhibitors.
- Schematic diagram of luciferase reporters expressing wild‐type or mutant SLC2A3 3′UTRs and wild‐type or mutant PGAM1 3′UTRs predicted by TargetScan and miRDB database.
- qRT–PCR was performed to determine the pri‐miR‐6769b and pri‐miR‐499a levels in HCT116 and Lovo (p53‐WT) cells transfected with control siRNA or METTL14 siRNAs for 48 h. Data are presented as mean ± SD (biological replicates, n = 3; **P < 0.01).
- qRT–PCR was performed to determine the miR‐6769b‐3p/miR‐499a‐3p and pri‐miR‐6769b/pri‐miR‐499a levels in p53‐MT (HT29 and SW620) cells transfected with control or METTL14 siRNAs for 48 h. Data are presented as mean ± SD (biological replicates, n = 3; ns = no significance).
- The sequences of pri‐miR‐6769b/pre‐miR‐6769b/miR‐6769b‐3p and pri‐miR‐499a/pre‐miR‐499a/miR‐499a‐3p are presented and highlighted by different colors. The m6A sites were predicted by SRAMP.
- qRT–PCR analysis of the pri‐miR‐6769b/pre‐miR‐6769b/miR‐6769b‐3p levels in HCT116 cells transfected with wild‐type or mutant pri‐miR‐6769b plasmids. Data are presented as mean ± SD (biological replicates, n = 3, **P < 0.01).
- qRT–PCR analysis of the pri‐miR‐499a/pre‐miR‐499a/miR‐499a‐3p levels in HCT116 cells transfected with wild‐type or mutant pri‐miR‐499a plasmids. Data are presented as mean ± SD (biological replicates, n = 3, **P < 0.01).
- qRT–PCR analysis of the pri‐miR‐6769b/pri‐miR‐499a levels in HCT116 cells transfected with empty vector, mutant METTL14 (MT‐METTL14) or wild‐type METTL14 (WT‐METTL14) plasmids for 48 h. Data are presented as mean ± SD (biological replicates, n = 3).
- Western blot and m6A dot blot analyses of METTL14, SLC2A3, PGAM1, and global m6A levels in HCT116 cells transfected with empty vector, MT‐METTL14 or WT‐METTL14 plasmids for 48 h.
Data information: For (B–D, G, H, J–L), statistical significance was determined by a two‐tailed Student's t‐test. ACTB and methylene blue were used as a loading control.
