
Figure EV5. METTL14 attenuates the development of p53‐WT CRC by repressing glycolysis through miR‐6769b‐3p/SLC2A3 and miR‐499a‐3p /PGAM1 axis.
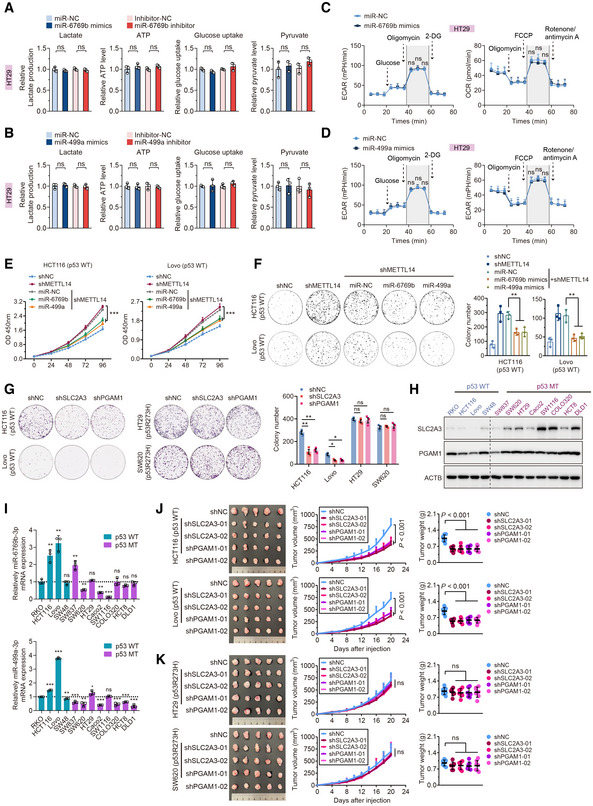
- Lactate production, ATP level, glucose uptake, and pyruvate level were determined in HT29 (p53‐MT) cells treated with control, miR‐6769b‐3p mimics, or inhibitor for 48 h. Data are presented as mean ± SD (biological replicates, n = 3; ns = no significance).
- Lactate production, ATP level, glucose uptake, and pyruvate level were determined in HT29 (p53‐MT) cells treated with control, miR‐499a‐3p mimics, or inhibitor for 48 h. Data are presented as mean ± SD (biological replicates, n = 3; ns = no significance).
- ECAR and OCR were measured in HT29 (p53‐MT) cells transfected with control or miR‐6769b‐3p mimics for 48 h. Data are presented as mean ± SD (biological replicates, n = 3; ns = no significance).
- ECAR and OCR were measured in HT29 (p53‐MT) cells transfected with control or miR‐499a‐3p mimics for 48 h. Data are presented as mean ± SD (biological replicates, n = 3; ns = no significance).
- Cell viability assay was performed in HCT116 and Lovo (p53‐WT) cells stably transfected with shNC or shMETTL14, or in the stable transfectants with shMETTL14 transfected with control, miR‐6769b‐3p or miR‐499a‐3p mimics. Data are presented as mean ± SD (biological replicates, n = 5, ***P < 0.001).
- Colony formation assay was performed in HCT116 and Lovo (p53‐WT) cells stably transfected with shNC or shMETTL14, or in the stable transfectants with shMETTL14 transfected with control, miR‐6769b‐3p or miR‐499a‐3p mimics. Data are presented as mean ± SD (biological replicates, n = 3, **P < 0.01).
- Colony formation assay was performed in p53‐WT (HCT116 and Lovo) and p53‐MT (HT29 and SW620) cells stably transfected with control, shSLC2A3 or shPGAM1. Data are presented as mean ± SD (biological replicates, n = 3, ns = no significance, *P < 0.05, **P < 0.01).
- Western blot analysis of SLC2A3 and PGAM1 in p53‐WT and p53‐MT CRC cell lines.
- qRT–PCR analysis of miR‐6769b‐3p and miR‐499a‐3p mRNA level in p53‐WT and p53‐MT CRC cell lines. Data are presented as mean ± SD (biological replicates, n = 3, ns = no significance, *P < 0.05, **P < 0.01, ***P < 0.001). The dotted line represents basal mRNA expression of miR‐6769b‐3p and miR‐499a‐3p in RKO cells, acting as a control.
- Representative images of tumors and analysis in nude mice intervened with control, shSLC2A3 or shPGAM1 expression p53‐WT (HCT116 and Lovo) cells. Data are presented as mean ± SD (biological replicates, n = 7).
- Representative images of tumors and analysis in nude mice intervened with control, shSLC2A3 or shPGAM1 expression p53‐MT (HT29 and SW620) cells. Data are presented as mean ± SD (biological replicates, n = 7).
Data information: For (A–G, J, K), statistical significance was determined by a two‐tailed Student's t‐test. ACTB was used as a loading control.