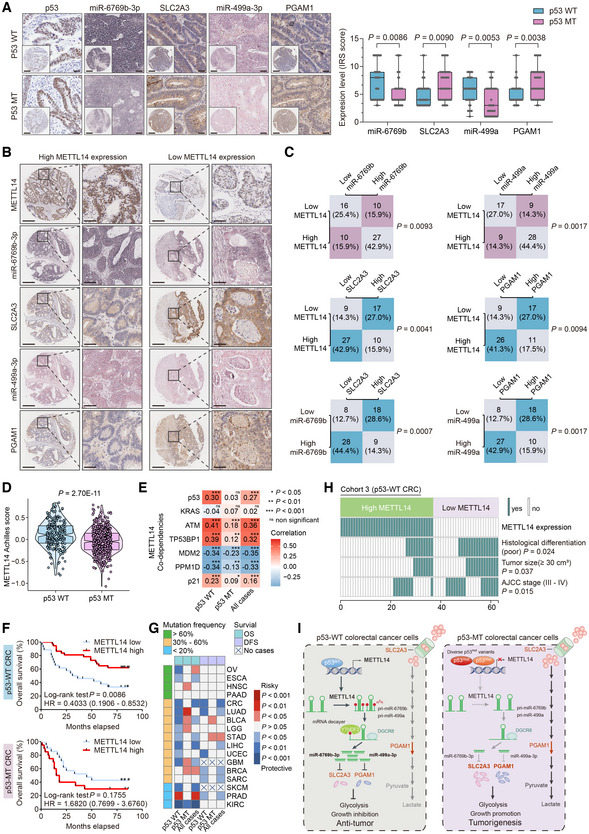
Figure 6. METTL14, miR‐6769b‐3p/SLC2A3, and miR‐499a‐3p/PGAM1 are clinically relevant in p53‐WT CRC patients.

- Representative IHC and ISH staining images and corresponding quantitative analysis of miR‐6769b‐3p/SLC2A3 IRS and miR‐499a‐3p/PGAM1 IRS in p53‐WT (n = 63) and p53‐MT (n = 41) samples from Cohort 3. The insets show enlarged images of indicated p53‐WT and p53‐MT CRC tissues, respectively. Scale bars = 200 μm and 20 μm (inset). The horizontal lines represent the median; the bottom and top of the boxes represent the 25 and 75% percentiles, respectively, and the vertical bars represent the range of the data.
- Representative IHC and ISH images of METTL14, SLC2A3, PGAM1, miR‐6769b‐3p, and miR‐499a‐3p in CRC tissues with higher or lower METTL14 expression in p53‐WT (n = 63) samples from Cohort 3. Right panels show enlarged images of indicated p53‐WT CRC tissues. Scale bars = 200 μm (left) and 20 μm (right).
- Statistical analysis of METTL14, SLC2A3, PGAM1, miR‐6769b‐3p, and miR‐499a‐3p in p53‐WT CRC tissues (n = 63) from Cohort 3.
- Achilles scores for METTL14 in p53‐WT cancer cells (n = 217) and p53‐MT cancer cells (n = 527).
- Association between METTL14 and p53, KRAS, ATM, TP53BP1, MDM2, PPM1D, and p21WAF1/Cip1 was analyzed by Pearson's correlation analysis in the CCLE dataset.
- Kaplan–Meier survival curves of OS in CRC patients with wild‐type p53 (n = 63) and mutant p53 (n = 41) from Cohort 3 database based on expression levels of METTL14.
- The survival analysis of OS and DFS in various tumors in TCGA database based on expression levels of METTL14. First, we have divided tumor patients diagnosed with the same tumor into patients with wild‐type p53, patients with mutant p53, and patients regardless of p53 status. Second, according to optimal cutoff values, patients in three groups were divided into a high‐expression METTL14 group and a low‐expression METTL14 group, respectively. Finally, Survival differences between the low‐expression METTL14 group and the high‐expression METTL14 group in each set were assessed by the Kaplan–Meier estimate and compared using the log‐rank test. Esophageal Cancer (ESCA); Bladder Cancer (BLCA); Lower Grade Glioma (LGG); Glioblastoma (GBM); Sarcoma (SARC); Skin Cutaneous Melanoma (SKCM).
- Comparison of clinicopathological characteristics between METTL14 high‐ and low‐expression tumors in p53‐WT patients from Cohort 3 (n = 63).
- Schematic diagram of the relationship among METTL14, glycolysis metabolism, and CRC progression.
Data information: For (A, D), statistical significance was determined by the nonparametric Mann–Whitney test. For (C), statistical significance was determined by the Fisher exact test. For E, statistical significance was determined by analysis of the Pearson's correlation coefficient. For (F, G), statistical significance was performed by the log‐rank test. For (H), statistical significance was performed by the Chi‐square test.
