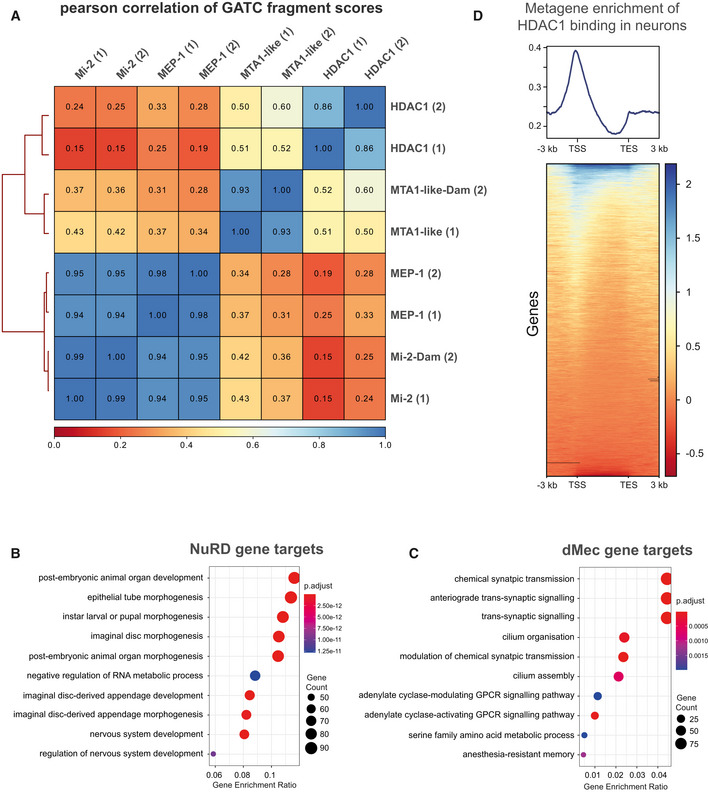
Figure EV1. Genomic binding of NuRD components.

- Correlation between NuRD subunits (including replicates) in larval neurons (elav‐GAL4). Very strong correlations are seen between Mi‐2 and MEP‐1 binding while the correlation between Mi‐2/MEP‐1 and either MTA‐1like or HDAC1 is relatively lower. Good correlations are exhibited between replicates for each subunit (spearman's correlation r 2 = 0.85–0.95).
- GO analysis of NuRD gene targets.
- GO analysis of dMec gene targets genes.
- Metagene analysis of HDAC1 binding. TSS is Transcriptional Start Site, and TES is Transcriptional End Site.
