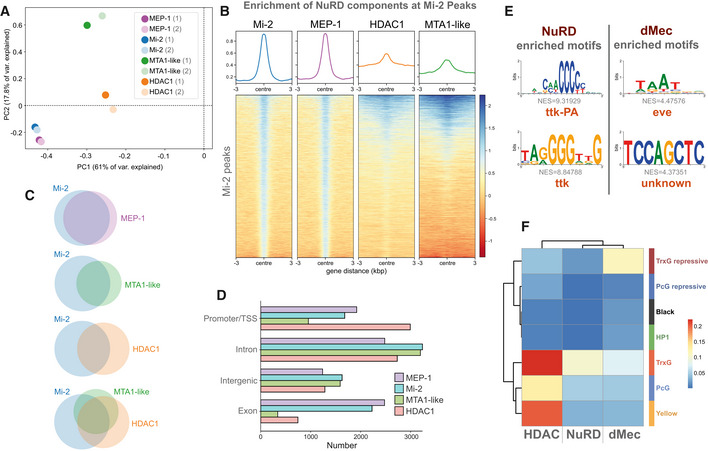
Figure 2. Genomic binding of NuRD components.

- Principal component analysis of all NuRD component binding in neurons including replicates. Mi‐2/MEP‐1 (blue/purple) cluster independently of MTA1‐like (green) and HDAC1 (orange) reflecting greater similarity in their binding profiles.
- Heatmap and enrichment plots indicating binding at Mi‐2 peaks.
- Venn diagrams indicating the number of overlapping peaks between NuRD subunits. All intersections between peaks occur at statistically significant frequencies (Fisher's exact test P < 10−24).
- Peak annotation for Mi‐2, MEP‐1, MTA‐1like and HDAC1 peaks.
- Top enriched motifs at NuRD and dMec peaks.
- Heatmap indicating jaccard similarity statistic between chromatin states and NuRD peaks (Mi‐2, MEP‐1, MTA‐1like and HDAC1) and dMEC (Mi‐2 and MEP‐1 only), or HDAC1 peaks.
