
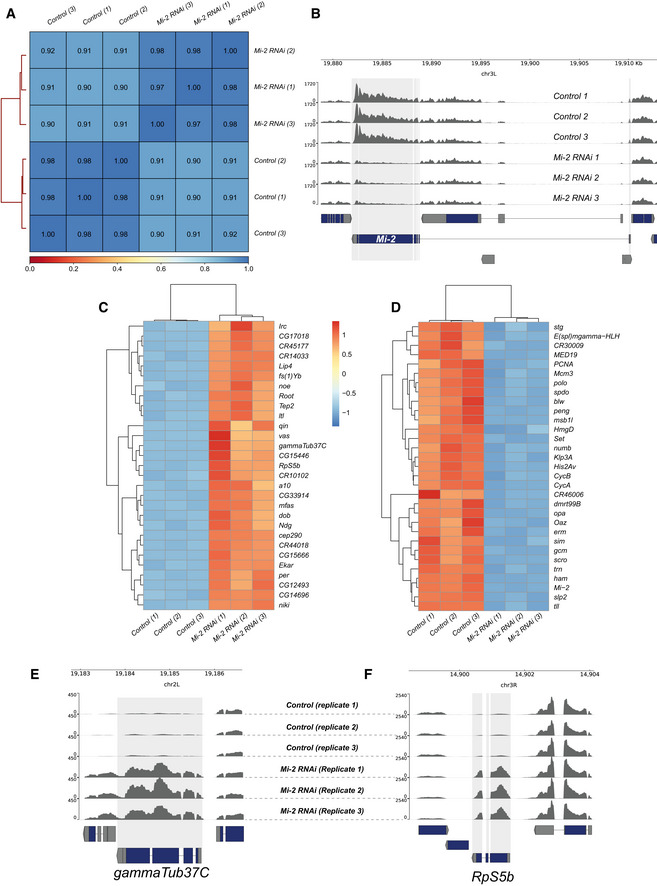
Figure EV2. RNA‐seq quality control and differentially expressed genes.
-
AHeatmap showing Pearson correlation of RNA‐seq reads between biological replicates and control and experimental groups. Very strong correlations are observed between replicates (R 2 > 0.97) with slightly lower correlations between knockdown and controls reflecting the changes in Mi‐2 RNAi transcriptome.
-
BGenome browser tracks indicating RNA‐seq read coverage at the Mi‐2 locus. Mi‐2 reads are clearly depleted in Mi‐2 RNAi compared with elav‐GAL4 × mCherry RNAi controls (adjusted P value < 2.2 × 10−227).
-
CHeatmap showing relative changes in normalised gene expression for the thirty most significantly upregulated genes.
-
DHeatmap showing relative changes in normalised gene expression for the 30 most significantly down‐regulated genes.
-
E, FRead coverage for (E) gammaTub37C and (F) RpS5b loci, which are non‐CNS genes ectopically expressed in Mi‐2 knockdown.