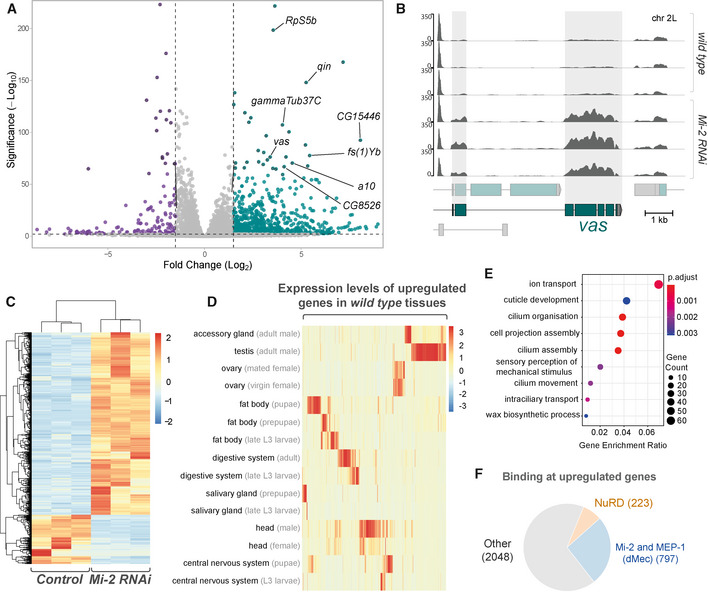
Figure 3. Mi‐2 knockdown in larval neurons results in extensive gene expression changes.

- Volcano plot showing significantly upregulated (green) and downregulated (purple) genes with fold‐change. Selected mis‐expressed genes are annotated.
- RNA‐seq tracks showing vas mRNA expression in third instar larval CNS (Y‐axis is RPKM).
- Heatmap showing relative changes in normalised read‐counts between Mi‐2 RNAi and control replicates for all significantly differentially expressed genes (P‐adj < 0.05, log2 fold change > 1 or < −1). Significantly more genes are upregulated (1467) than downregulated (397).
- Heatmap showing relative expression levels of upregulated genes across selected Drosophila tissues (full version in Appendix Fig S2).
- Enriched gene ontology terms for genes that are upregulated in Mi‐2 RNAi knockdown.
- Proportion of differentially upregulated genes that directly intersect with Mi-2, MEP-1, MTA-1like and HDAC1 peaks, and differentially upregulated genes intersecting with exclusively Mi-2/MEP-1 or all NuRD subunits.
