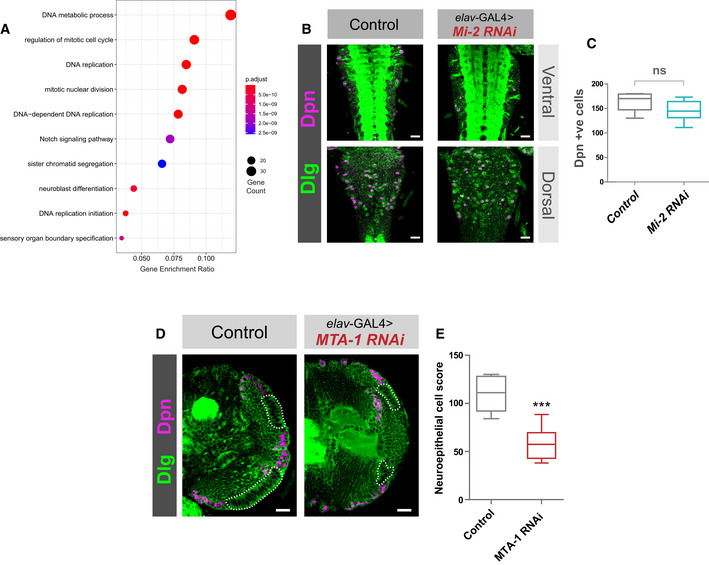
Figure EV3. NuRD knockdown larval brain phenotypes.

- GO analysis of downregulated genes.
- Mi‐2 knockdown does not affect NSC numbers in the VNC. (B) Example images from ventral and dorsal sections of the VNC. Scale bars = 20 μm.
- Quantification of Dpn‐positive cells (no significant difference). Six VNCs measured for each genotype. No significant difference (two‐tailed student's t‐test). Represented as a box plot.
- MTA1‐like knockdown causes an optic lobe phenotype. (D) Representative images of control (elav‐GAL4;; mCherry RNAi), and MTA1‐like knockdown in the third instar larval CNS (all scale bars = 20 μm). Discs large (Dlg) = green, Deadpan (Dpn) = magenta. Neuroepithelial cells are highlighted by dashed lines.
- Quantification of optic lobe neuroepithelial cells of genotypes shown in panel A. At least eight brains measured for each genotype. ***P < 0.001 (one‐tailed student's t‐test). Represented as a box plot.
