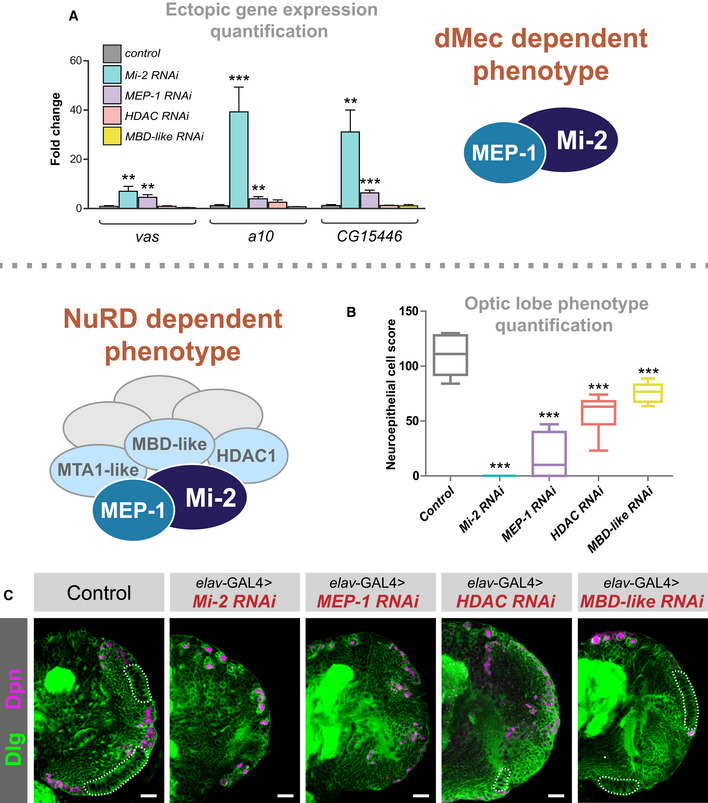
Figure 4. dMec knockdown causes ectopic gene expression and NuRD knockdown in neurons causes an optic lobe development phenotype.

- Quantification of candidate gene expression (selected from upregulated genes in RNA‐seq data) in knockdown genotypes (three biological replicates for each group). **P < 0.01 and ***P < 0.001 (one‐tailed student's t‐test or Welch's t‐test against control) Represented as mean ± SEM.
- Quantification of optic lobe neuroepithelial cells of genotypes shown in panel C (n >= 9 for each group). ***P < 0.001 (one‐tailed student's t‐test or Welch's t‐test against control). Represented as a box plot.
- Representative images of control (elav‐GAL4;; mCherry RNAi ), Mi‐2 knockdown, MEP‐1 knockdown, HDAC1 knockdown and MBD‐like knockdown in the third instar larval CNS (all scale bars = 20 μm). Discs large (Dlg) = green, Deadpan (Dpn) = magenta. Neuroepithelial cells are highlighted by dashed lines.
