
Figure 4.
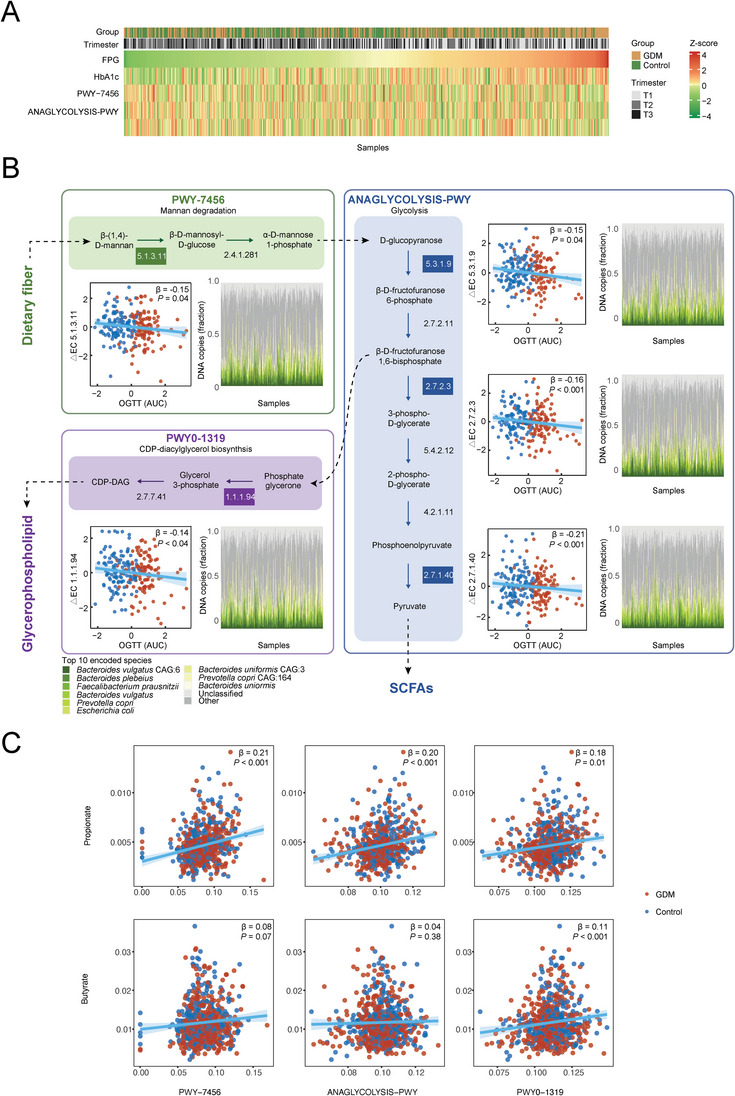
A) The associations of microbial fiber fermentation related pathways with host glucose metabolism during pregnancy (Revised part). B)The associations of changes in key enzymes from T1 to T2 within the pathways of polysaccharide degradation (green), glycolysis (blue), and phospholipid biosynthesis (purple) with host OGTT glucose. The scatter plots showed the associations of these enzymes’ temporal change (from T1 to T2) with the area under OGTT glucose curve in T2. Red and blue dots indicated GDM patients and controls, respectively. The stack plots showed the proportions of enzymes encoded by specific species, whose colors were shown in the top legend. C) The associations of fermentation pathways and fecal levels of propionate and butyrate.