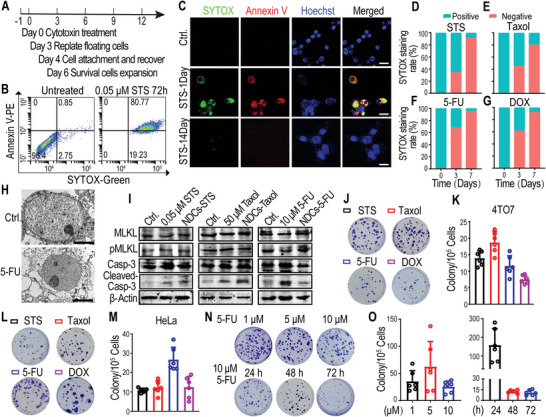
Figure 1.

Identification of a subpopulation of near‐death cancer cells (NDCs) derived from cancer cell lines. A) Schematic representation of NDC induction using lethal concentrations of the chemotherapeutic drugs. B) Flow cytometry analyses of the plasma membrane integrity and apoptosis of floating cells (4TO7 cells treated with 0.05 × 10⁻⁶ m staurosporine [STS] for 72 h) using SYTOX‐Green/Annexin V‐PE dye. C) Confocal images of re‐adherent cells derived from floating cells (4TO7 cells treated with 0.05 × 10⁻⁶ m STS for 72 h) after the indicated recovery times by staining with Annexin V‐PE/Hoechst/SYTOX‐Green. SYTOX‐Green‐positive staining in the nucleus, representing the loss of NDC plasma membrane integrity. The scale bars represent 25 µm. D–G) The percentage of SYTOX‐Green‐positive adherent cells derived from floating 4TO7 cells after the indicated recovery times. The floating 4TO7 cells were collected after treatment with D) STS (0.05 × 10⁻⁶ m), E) Taxol (50 × 10−6 m), F) 5‐fluorouracil (5‐FU; 10 × 10−6 m), or G) doxorubicin (DOX; 1 × 10⁻⁶ m) for 72 h; cells were re‐plated to recover for the indicated times, then stained with SYTOX‐Green. The data represent the mean of three biological replicates. H) Transmission electron microscopy scanning of parental HeLa cancer cells (Ctrl.) and re‐adherent 5‐FU‐treated HeLa cells after 14 days of culture. The scale bars represent 1 µm. I) Western blot analysis of the expression of apoptosis (cleaved caspase‐3) and necroptosis (pMLKL) markers in cytotoxin‐treated cells (harvested 72 h after treatment) and cytotoxin‐derived 4TO7 NDCs. β‐Actin was used as the protein loading control. J–M) Representative J,L) crystal violet staining and K,M) numbers of colonies derived from 1 × 10⁵ cytotoxin‐induced floating J,K) 4TO7 cells and L,M) HeLa cells. N,O) Representative N) crystal violet staining (upper panel) and O) numbers (left panel) of repopulated colonies derived from 1 × 10⁵ floating 4TO7 cells that were treated with different concentrations of 5‐FU for 72 h. Representative N) crystal violet staining (lower panel) and O) numbers (right panel) of repopulated colonies derived from 1 × 10⁵ floating 4TO7 cells that were harvested at the indicated time after 10 × 10−6 m 5‐FU treatment. n = 6 biological replicates in (K, M, O).
