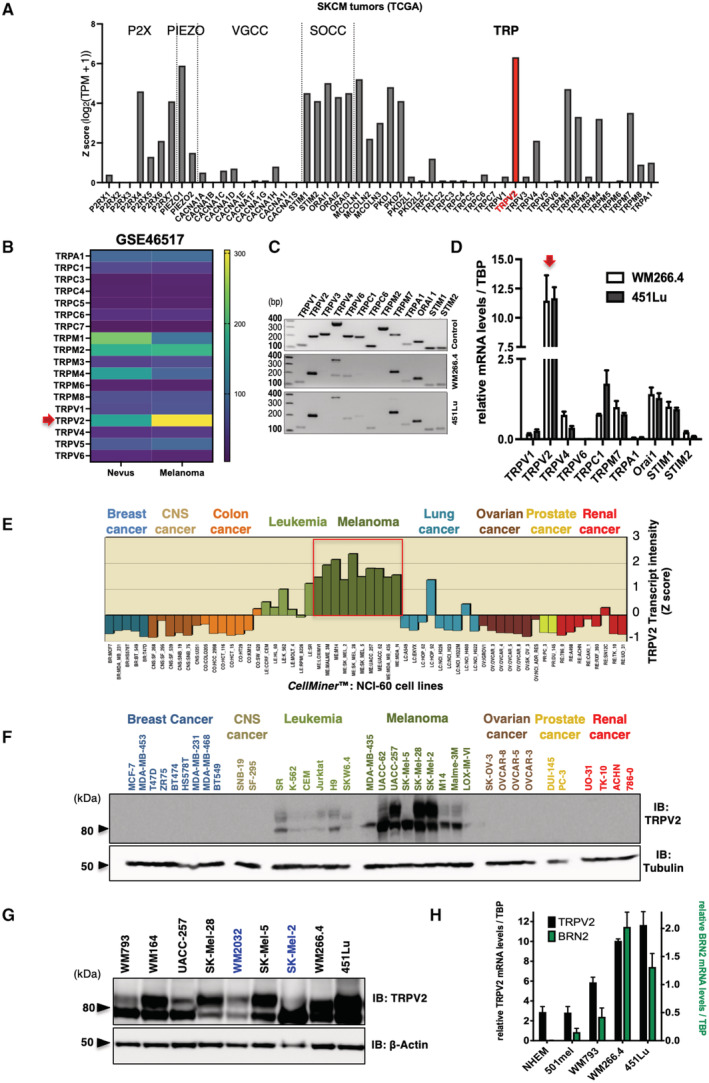
Figure 1. TRPV2's strong and predominant expression is a hallmark of metastatic melanoma.

- Analysis of Ca2+‐permeable channels mRNA expression levels (RNAseq data from the TCGA cohort) in skin cancer melanoma (SKCM) tumors (n(T) = 461). Transcript intensity is expressed as log2(TPM + 1) transformed expression data (Tang et al, 2017). The Ca2+‐permeable channels plotted on the x‐axis are grouped by family: ATP‐gated P2X; PIEZO; VGCC (voltage‐gated Ca2+ channels); SOCC (store‐operated Ca2+ channels); TRP (transient receptor potential).
- Heatmap comparing TRP channels RNA expression levels (mean of the normalized probe intensities) in nevi (n = 9) and melanomas (n = 104) biopsies (GEO: GSE46517; Data ref: Kwong et al, 2013). Probe set ID: TRPA1 217590_s_at; TRPC1 205802_at;TRPC3 206425_s_at; TRPC4 220817_at; TRPC6 206528_at; TRPC7 208589_at; TRPM1 206479_at; TRPM2 205708_s_at; TRPM3 211422_at; TRPM4 219360_s_at; TRPM6 221102_s_at; TRPM8 220226_at; TRPV1 219632_s_at; TRPV2 219282_s_at; TRPV4 219516_at; TRPV5 208267_at; TRPV6 206827_s_at; no probe for TRPM5/TRPM7/TRPV3 in the used [HG‐U133A] Affymetrix Human Genome U133A Array. The red arrow points to TRPV2.
- Expression profile of the indicated ion channel analyzed by RT‐PCR in the WM266.4 and 451Lu metastatic melanoma cell lines (middle and bottom panels, respectively). Expected amplicons sizes (positive controls in top panel) are in base pairs (bp): TRPV1 = 120, TRPV2 = 199, TRPV3 = 226, TRPV4 = 190/370, TRPV6 = 208, TRPC1 = 201, TRPC6 = 121, TRPM2 = 303, TRPM7 = 226, TRPA1 = 140, Orai1 = 161, STIM1 = 109, STIM2 = 114.
- Quantitative RT‐PCR expression analyses of channel subunits consistently detected in both the WM266.4 and the 451Lu melanoma cell lines. Transcript levels were normalized to TATA box‐binding protein (TBP) mRNA levels. Data are represented as mean ± SEM (n = 3 biological replicates). The red arrow points to TRPV2.
- Relative TRPV2 mRNA expression analysis in the NCI‐60 cell lines panel. y‐axis represents TRPV2 transcript intensity expressed in mean‐centered z‐score; bars either show increased or decreased expression relative to the mean expression. The cell lines plotted on the x‐axis are grouped by tissue of origin. CNS: central nervous system. Data were generated by querying for TRPV2 as input in CellMiner™ (http://discover.nci.nih.gov/cellminer/; Reinhold et al, 2012; See also Appendix Fig S1).
- TRPV2 immunoblotting in 36 out of the 60 NCI‐60 cell lines. Tubulin was used as a loading control. Note that after longer exposure times, TRPV2 expression was also detected in some breast and prostate cancer cell lines, as it has been previously described (Monet et al, 2010; Gambade et al, 2016; Elbaz et al, 2018).
- TRPV2 protein expression in melanoma cell lines harboring either B‐RAF (black) or N‐Ras (blue) mutations. β‐Actin was used as a loading control.
- Quantitative RT‐PCR analysis of both TRPV2 (black bars, left axis) and BRN2 (green bars, right axis) transcripts expression (normalized to TBP), in normal human epidermal melanocytes (NHEM), noninvasive 501mel, superficial spreading melanoma WM793, metastatic melanoma WM266.4 and 451Lu cell lines. BRN2 is a marker of the melanoma invasive phenotype (see also Appendix Fig S4 for active β‐catenin levels representing an alternative invasive marker). Data are represented as mean ± SEM (n = 3 biological replicates).
Source data are available online for this figure.
