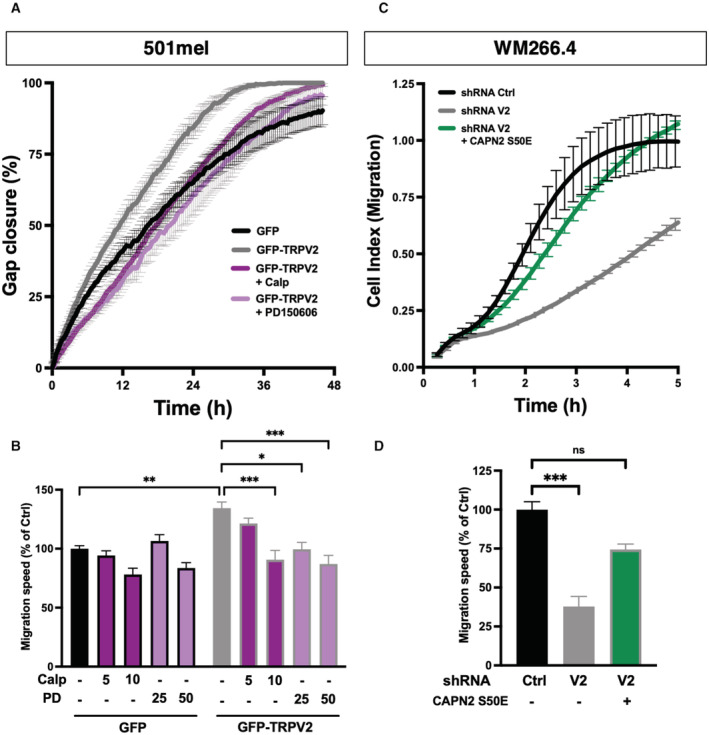
Figure EV2. TRPV2 promotes melanoma cell migration through the recruitment of Calpain activity (relative to Fig 5).

- Representative gap closure kinetics from wound‐healing assays performed on 501mel cells control (GFP) and 501mel cells overexpressing TRPV2 (GFP‐TRPV2) treated either with vehicle, 10 μM calpeptin or 50 μM PD150606. Each data point represents the mean ± SEM of n = 4 technical replicates.
- Quantification of the impact of calpain pharmacological inhibition on TRPV2‐dependent cell migration. Cell migration speed was assessed as the slope of gap closure kinetics measured for the first 24 h of the wound‐healing assays to avoid potential proliferation‐induced effects. Histogram illustrates migration speed normalized to 501mel GFP control cells presented as mean ± SEM of n = 4 biological replicates with statistical analysis performed using the Kruskal–Wallis test followed by Dunn's multiple comparisons tests (*P < 0.05; **P < 0.01; ***P < 0.001, ns = nonsignificant; See Appendix Table S3 for exact P‐values).
- Representative cell migration kinetics from xCELLigence CIM‐plate assays performed on GFP‐transfected shRNA Ctrl WM266.4 cells, GFP‐transfected shRNA V2 WM266.4 cells and shRNA V2 WM266.4 cells transfected with constitutively active Calpain‐2 (GFP‐CAPN2S50E). Each data point represents the mean ± SD of the Cell Index—a unit automatically computerized by the xCELLigence software—resulting from technical replicates in two independent wells recorded in parallel from the same CIM‐plate. Here, we did not use wound‐healing assays due to the specific context of transient transfection and because active calpain expression modifies cell adhesion properties making it difficult to obtain nice cell monolayers with delimited wounds.
- Quantification of the ability of active calpain forced expression to rescue the cell migration defect induced by TRPV2 silencing. Cell migration speed was assessed as the slope of the Cell index during the exponential phase. Histogram illustrates cell migration normalized to WM266.4 shRNA Ctrl cells presented as mean ± SEM of n = 3 biological replicates with statistical analysis performed using the Kruskal–Wallis test followed by Dunn's multiple comparisons test (***P = 0.0004 and ns P = 0.1484).
Source data are available online for this figure.
