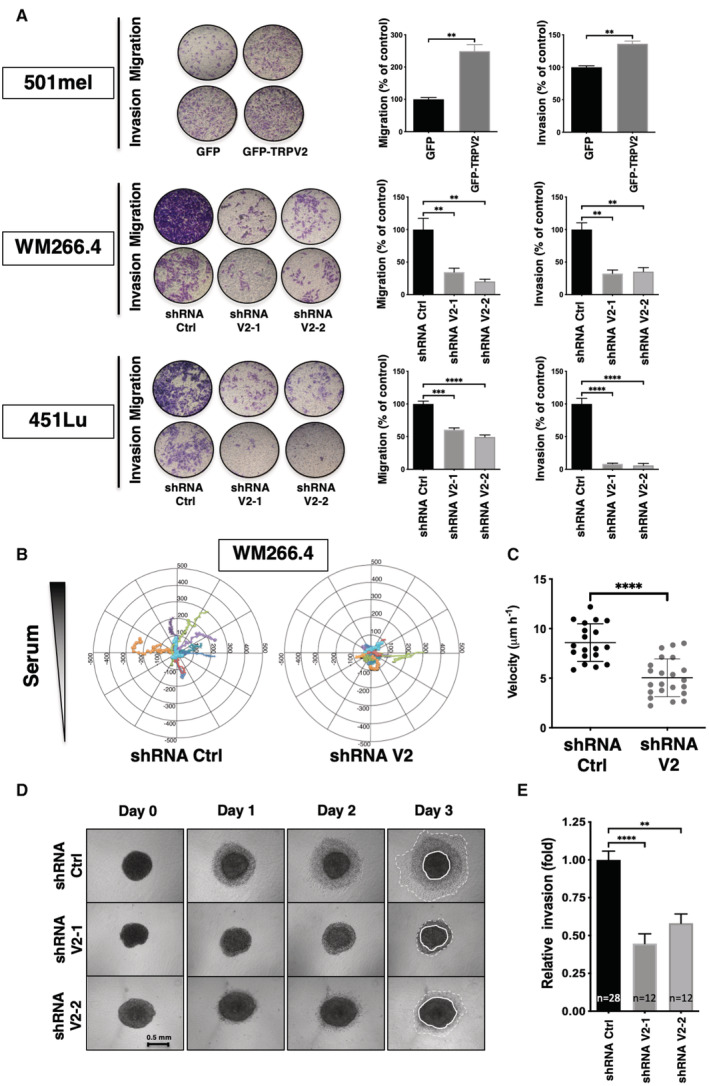
Figure 3. TRPV2 is essential for melanoma tumor cell migration and invasion.

- Impact of TRPV2 genetic manipulation in 501mel, WM266.4 and 451Lu on serum‐induced migration and matrigel invasion. Representative pictures show crystal violet‐stained cells that have migrated through 8 μm pore size membranes. Histograms illustrate the average numbers of migrating/invading cells normalized to control (presented as mean ± SEM of n = 3 independent experiments). For 501mel the Mann–Whitney test was used for statistical analysis (**P = 0.0022); For WM266.4&451Lu one‐way ANOVA followed by Dunnett's multiple comparisons tests was used (**P < 0.01; ***P < 0.001; ****P < 0.0001; See Appendix Table S2 for exact P‐values).
- Tracks comparison between fibronectin‐plated shRNA Ctrl or shRNA V2 WM266.4 cells migrating towards a serum gradient over a 12 h period (n = 10 and 12 cells, respectively) (See also Appendix Fig S3B).
- Velocity analysis of 2D migration experiments described in B (dot, single cell, n = 19–21). Scatter plots show mean ± SD. ****P < 0.0001, the Mann–Whitney test.
- TRPV2‐silencing effect on 3D invasion. Representative images were taken every day for 3 days after collagen embedding of spheroids from WM266.4 cells expressing either shRNA ctrl or TRPV2‐targeting shRNAs (scale bar = 0.5 mm).
- Quantification of collagen invasion. For each spheroid, the cell‐covered area at day 2 was normalized to the starting area of the collagen‐embedded spheroids. Histograms represent the invasion relative to control WM266.4 spheroids (shRNA Ctrl) from at least 12 spheroids from three independent experiments (See also Appendix Fig S3C). M. ****P < 0.0001 and **P = 0.0012 the Kruskal–Wallis test followed by Dunn's multiple comparisons test.
Source data are available online for this figure.
