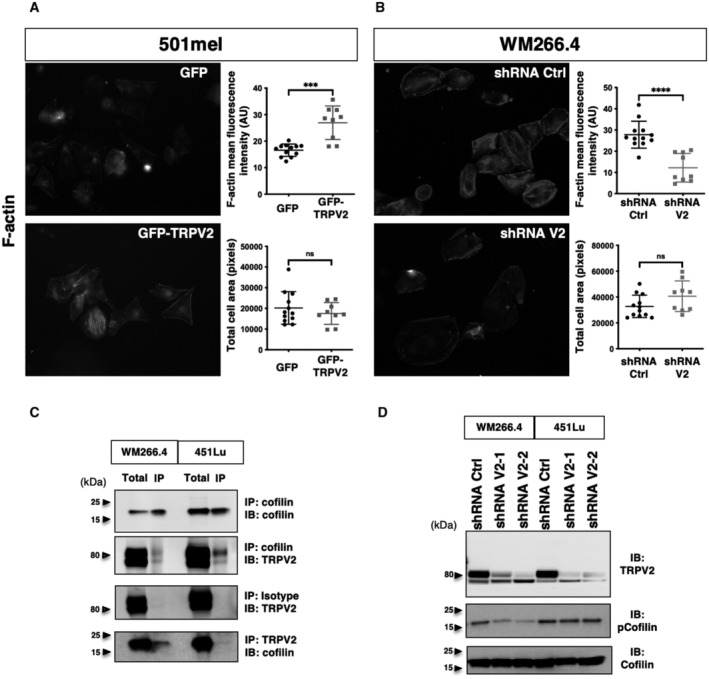
Figure EV3. TRPV2 Regulates Actin cytoskeleton remodeling and cofilin activation.

-
A, BFluorescent microscopy images showing live F‐actin polymerization in control (GFP) or GFP‐TRPV2 overexpressing 501mel cells (A), and in control (Ctrl) or TRPV2‐targeting shRNAs transduced WM266.4 cells (B). Quantification of F‐actin fluorescent intensity (top plot) and cell area (bottom plot) in both populations. Data are presented as scatter dot plots with mean ± SD, each dot representing mean F‐actin fluorescence intensity or mean area per cell in n = 13–16 fields from three independent experiments (***P = 0.0005 and ns P = 0.7021 for 501mel, ****P < 0.0001 and ns P = 0.1308 for WM266.4, the Mann–Whitney test).
-
CReverse co‐immunoprecipitation (IP) experiments showing a physical interaction between TRPV2 and cofilin in the WM266.4 and 451Lu metastatic melanoma cell lines. Co‐IP experiments were performed three times and the immunoblots (IB) show typical results.
-
DImmunoblot assessment of cofilin activation by measuring total and Ser3‐phosphorylated cofilin levels in control (shRNA Ctrl) and TRPV2‐silenced (shRNA V2) WM266.4 and 451Lu cells.
Source data are available online for this figure.
