
Figure 4. TRPV2 specifically associates with paxillin, a marker of nascent adhesive structures.
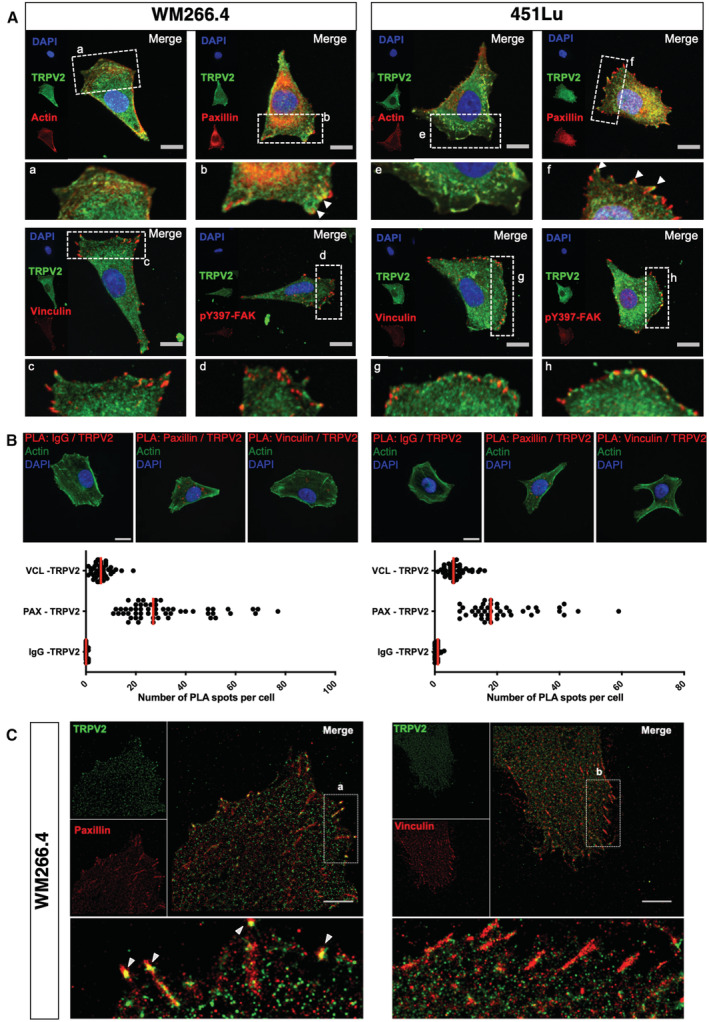
- Representative confocal images of low confluency WM266.4 and 451Lu metastatic melanoma cells seeded on fibronectin‐coated coverslips. Cell nuclei are depicted with DAPI in blue, TRPV2 in green and indicated proteins (actin, paxillin, vinculin or pY397‐FAK) in red (scale bar = 20 μm). Insets are magnifications of the indicated area. Arrows indicate sites of colocalization.
- Representative confocal images of the in situ detection of endogenous TRPV2 interactions with paxillin and vinculin by proximity‐ligation assays (PLA). Low confluency WM266.4 and 451Lu metastatic melanoma cells plated on fibronectin‐coated coverslips were stained for F‐actin (green), cell nuclei (blue) and PLA reaction using antibodies specific of the indicated proteins (red) (scale bar = 20 μm; identical for all pictures). Red fluorescent spots indicate the association of the two proteins of interest, close to 40 nm. Scatter plots represent the quantification of the number of PLA spots per cell (bars indicate the medians) between TRPV2 and a control antibody (IgG), paxillin (PAX), or vinculin (VCL) (n = 29–51 cells from at least three independent experiments).
- Super‐resolution (dSTORM) imaging of the clustering of TRPV2 channels with paxillin, but not with vinculin, in migrating WM266.4 cells (Scale bar = 5 μm). a and b insets show expanded views of a region of the cell and arrows highlight TRPV2 channel and paxillin co‐clusters.
Source data are available online for this figure.