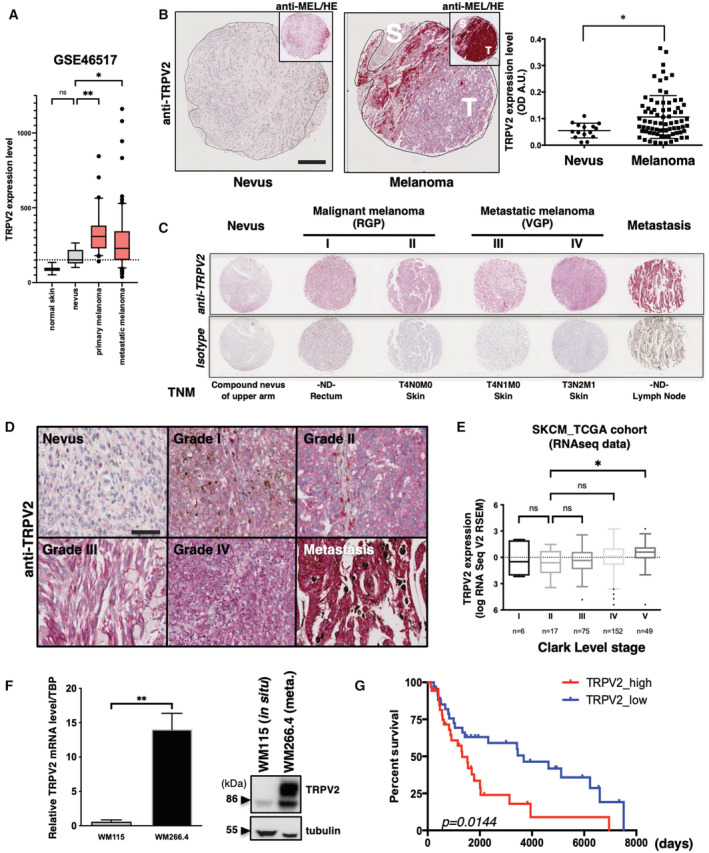
Figure 7. TRPV2 expression is associated with malignancy and poor prognosis in human melanoma.

- TRPV2 RNA expression levels (microarray probe: 219282_s_at) measured in normal skin (n = 7 biological replicates), nevi (n = 9 biological replicates), primary (n = 31 biological replicates) and metastatic (n = 73 biological replicates) melanomas (GEO: GSE46517; Data ref: Kwong et al, 2013). TRPV2 levels are increased in malignant lesions compared to normal skin and nevi. Data are represented as a box and whiskers plot with outliers plotted as individual points (Boxes extend from the 25th to 75th percentiles, whiskers from the 10th to 90th percentiles, the horizontal line in each box is plotted at the median; ns P = 0.1383, *P = 0.0488 and **P = 0.0016, the Kruskal–Wallis test). The horizontal dotted line corresponds to TRPV2 median expression in nevi.
- Representative melanoma tissue lesions from a tissue microarray (TMA) comparing TRPV2 staining between a benign nevus and a malignant melanoma (See also Appendix Fig S10) (Scale bar = 200 μm). Top right insets show the same images stained with an anti‐melanoma triple cocktail (HMB45+A103 (Melan‐A)+T311(Tyrosinase)). Regions depicted with a black line represent the interface between the diffusely stained tumor (T) and the surrounding normal stroma (S). Right panel shows the scatter plot of the complete quantification of TRPV2 staining in 77 patients with malignant melanoma compared to 16 nevi tissues (dot, single patient sample) with lines for mean ± SEM (*P = 0.0473, the Mann–Whitney test).
- Comparison of six representative tissues from patients at different TNM grades of melanoma progression stained with anti‐TRPV2 or the isotype control. RGP, radial growth phase; VGP, vertical growth phase.
- Representative images showing detailed TRPV2 staining from in situ melanoma lesions with progressive TNM grades and from lymph node (LN) metastasis (Scale bar = 50 μm).
- TRPV2 mRNA expression (from the TCGA cohort RNAseq data) according to Clark level pathological cancer stages. This grading system describes the level of anatomical invasion of the melanoma; I: confined to the epidermis (in situ); II: invasion into the papillary dermis; III: invasion to the junction of the papillary and reticular dermis; IV: invasion into the reticular dermis; V: invasion into the subcutaneous fat. TRPV2: mRNA expression z‐scores relative to all samples are represented as a box and whiskers plot with outliers plotted as individual points (Boxes extend from the 25th to 75th percentiles with Tukey whiskers, the horizontal line in each box is plotted at the median; n are indicated on the plot; ns P = 0.5647 for II vs. IV or > 0.9999 for all other comparisons, *P = 0.0348, the Kruskal–Wallis test).
- Analysis of TRPV2 expression by quantitative RT‐PCR (left panel) and western blot (right panel) in the WM115/WM266.4 pair of isogenic melanoma cell lines. The WM115 cell line was derived from an in situ tumor while the WM266.4 was established from a skin metastasis of the same patient. Relative transcript levels are presented as mean ± SEM from n = 4–9 biological replicates (**P = 0.0028, the Mann–Whitney test).
- Kaplan–Meier plot showing the association of TRPV2 expression (10% highest vs. 10% lowest expressers in the skin cutaneous melanoma cohort TCGA dataset) with melanoma patient survival (*P = 0.0144, the Log‐rank (Mantel–Cox) test).
Source data are available online for this figure.
