
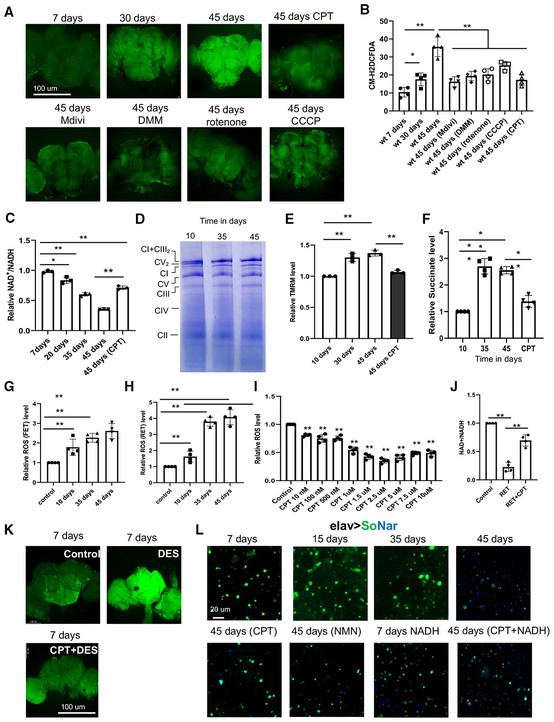
Figure 1. Active RET leads to increased ROS and decreased NAD+/NADH ratio in aged flies.
-
A, BCM‐H2DCFDA staining (A) and data quantification (B) showing H2O2 level in different aged fly brains with and without treatment with the indicated RET inhibitors (n = 5 per group).
-
CQuantification of NAD+/NADH ratio in different aged flies with and without CPT treatment (n = 3 groups, 20 flies per group).
-
DBN‐PAGE showing mitochondrial complex and supercomplex assembly in 10‐day, 35‐day and 45‐day‐old flies.
-
ETMRM staining assessing mitochondrial MMP in different aged flies and in old flies treated with CPT (n = 3).
-
FQuantification of mitochondrial succinate level in different aged flies and in aged flies treated with CPT.
-
G, HQuantification of RET‐ROS in mitochondria isolated from different aged flies and respiring under FET (G) or RET (H) condition (n = 4).
-
IDose‐dependent effect of CPT on RET‐ROS in mitochondria isolated from 45‐day‐old flies and respiring under RET condition (n = 4).
-
JQuantification of the effect of CPT on NAD+/NADH ratio in mitochondria isolated from 45‐day‐old flies and respiring under RET condition (n = 4).
-
KCM‐H2DCFDA staining showing H2O2 level in young flies treated with DES or DES + CPT (n = 5 per group).
-
LLive imaging with SoNar showing NAD+ (green) and NADH (blue) levels in different aged fly brains with or without treatment with the indicated chemicals.
Data information: Data are representative of at least three repeats. Data are shown as mean ± SEM. Asterisks indicate statistical significance (**P < 0.01, *P < 0.05) using single‐factor ANOVA with Scheffe's analysis as a post hoc test to compare two sets of data.