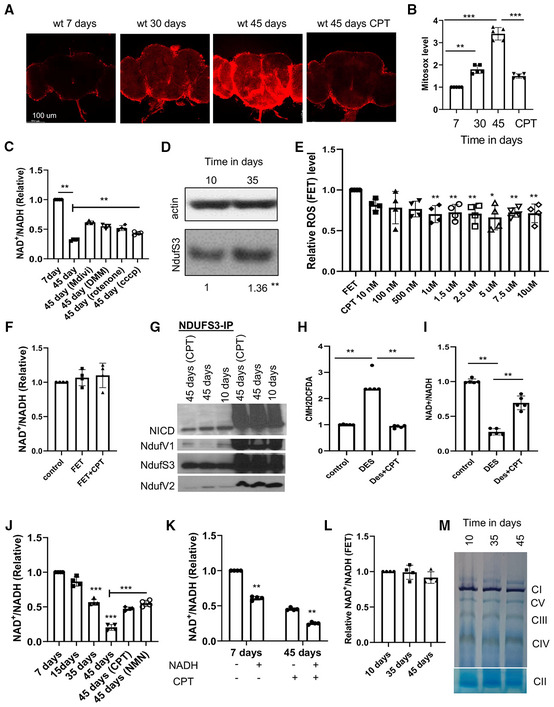
Figure EV1. Active RET leads to increased ROS and decreased NAD+/NADH ratio in aged flies.

-
A, BMito‐Sox staining (A) and data quantification (B) showing mitochondrial ROS level in different aged fly brains with or without treatment with the indicated RET inhibitors (n = 5 per group).
-
CQuantification of NAD+/NADH ratio in young flies, old flies, and old flies treated with the indicated chemicals.
-
DWestern blot analysis comparing NDUFS3 level in young and aged flies. **P < 0.01 in Student's t‐test.
-
EQuantification of FET‐ROS in isolated mitochondria purified from aged wild‐type flies and assayed under FET condition without or with treatment at the indicated concentrations of CPT (n = 4).
-
FQuantification of NAD+/NADH ratio in isolated mitochondria after induction of FET and with or without CPT (2.5 μM) treatment (n = 4).
-
GCo‐immunoprecipitation assay showing the effect of aging and CPT treatment on the various protein–protein interactions between C‐I proteins involved in RET.
-
HQuantification of ROS level from brain samples of DES and DES + CPT‐treated flies (n = 4).
-
IQuantification of NAD+/NADH ratio from brain samples of DES and DES + CPT‐treated flies (n = 5 sets, 20 flies per set).
-
JQuantification of NAD+ and NADH levels measured with SoNar in different aged fly brains with or without treatment with the indicated chemicals as shown in Fig 1D (n = 4 sets, 5 flies per set).
-
KQuantification of NAD+/NADH ratio in wild‐type flies treated with CPT or co‐treated with CPT and NADH (n = 4 sets, 20 flies per set).
-
LMitochondrial C‐I activity assay using mitochondria purified from different aged flies (n = 3).
-
MIn‐gel activity assays of respiratory complexes using mitochondria purified from different aged flies.
Data information: Data are representative of at least three repeats. Data are shown as mean ± SEM. Asterisks indicate statistical significance (**P < 0.01) in single‐factor ANOVA with Scheffe's analysis as a post hoc test.
