
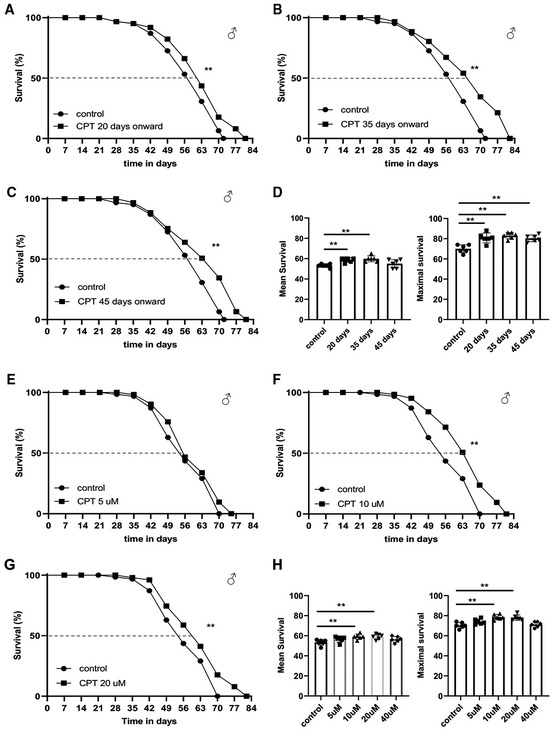
Figure 2. Inhibition of RET by CPT treatment extends Drosophila lifespan.
-
A–DSurvival curves comparing overall survival (by logrank test) and maximum lifespan (by Wang–Allison test) of control flies and flies fed with food containing 10 μM CPT from 20 days (**P < 0.01 logrank, **P < 0.01 Wang–Allison) (A), 30 days (**P < 0.01 logrank, **P < 0.01 Wang–Allison) (B), or 45 days (**P < 0.01 logrank, **P < 0.01 Wang–Allison) (C) onwards. Bar graphs (D) show the quantification of mean and maximal lifespan (n = 3 groups, 20–25 flies per group).
-
E–HSurvival curves comparing control flies and flies fed with food containing 5 μM CPT (E), 10 μM CPT (**P < 0.01 logrank, **P < 0.01 Wang–Allison) (F), or 20 μM CPT (**P < 0.01 logrank, **P < 0.01 Wang–Allison) (G) from 35 days onwards. Bar graphs (H) show the quantification of mean and maximal lifespan (n = 3 groups, 20–25 flies per group), using single‐factor ANOVA with Scheffe's analysis as a post hoc test.
Data information: Data are representative of at least three repeats. (D, H) Data are shown as mean ± SEM. Survival curves were analyzed with logrank test along with Wang–Allison test for maximum lifespan. Asterisks indicate statistical significance (**P < 0.01, *P < 0.05). Dashed lines mark time points of 50% survival.