
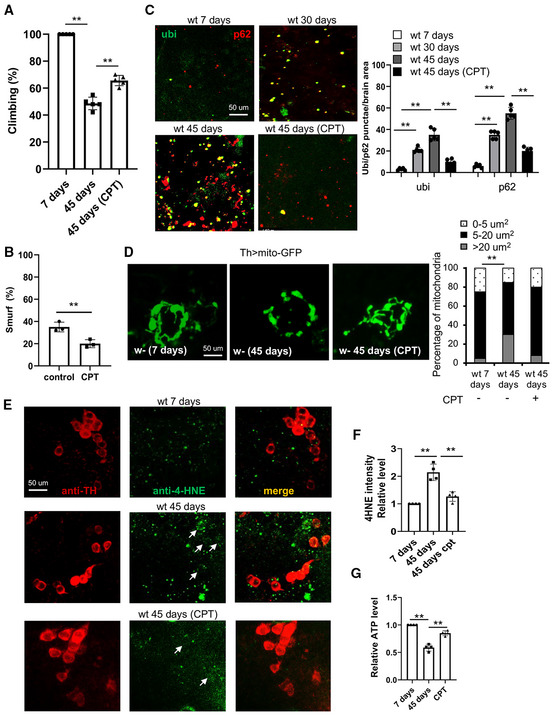
Figure 3. Effect of RET inhibition by CPT on healthspan in Drosophila .
-
AClimbing assay of young flies, old flies, and old flies treated with CPT (n = 3 groups, 20 per group).
-
BSmurf assay of intestinal integrity in aged flies with or without CPT treatment (n = 3 groups, 20 per group).
-
CImages and data quantification showing accumulation of protein aggregates in the brains of aged flies with or without CPT treatment (n = 5).
-
DImages and data quantification showing DA neuron mitochondrial morphology in the brains of aged flies with or without CPT treatment (n = 5).
-
E, FImages (E) and data quantification (F) showing 4‐HNE levels within or near TH‐positive DA neurons in young flies, old flies, and old flies treated with CPT (n = 4 sets, 5 samples per set). Arrows point to HNE signals co‐labeled with TH‐ positive DA neurons.
-
GQuantification of ATP levels in young flies, old flies, and old flies treated with CPT.
Data information: Data are representative of at least three repeats. Data are shown as mean ± SEM. Asterisks indicate statistical significance (**P < 0.01) in single‐factor ANOVA with Scheffe's analysis as a post hoc test.