
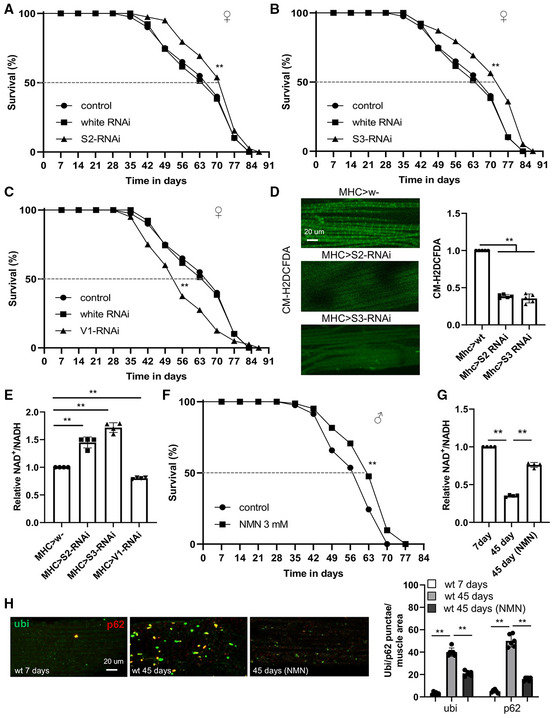
Figure 4. Inhibition of RET by genetic manipulation of C‐I subunits extends fly lifespan.
-
A–CSurvival curves of control flies and flies with muscle‐specific knockdown of NDUFS2 (**P < 0.01 logrank) (A), NDUFS3 (**P < 0.01 logrank, **P < 0.01 Wang–Allison) (B), or NDUFV1 (**P < 0.01 logrank) (C) (n = 3 groups, 20–25 flies per group).
-
DCM‐H2DCFDA staining of H2O2 and quantification of signal intensity in the muscle tissues of 50‐day‐old control flies and flies with NDUFS2 or NDUFS3 knockdown (n = 5 per group).
-
EQuantification of NAD+/NADH in 50‐day‐old control flies and flies with NDUFS2, NDUFS3, or NDUFV1 knocked down by RNAi.
-
FSurvival curves of wild‐type flies with or without NMN treatment from 35 days onwards (**P < 0.01 logrank, **P < 0.01 Wang–Allison) (n = 3 groups, 20–25 flies per group).
-
GQuantification of NAD+/NADH in young flies, old flies, and old flies treated with CPT.
-
HImages and data quantification showing accumulation of protein aggregates in the muscle of young flies, old flies, and old flies treated with CPT (n = 5 per group).
Data information: Data are representative of at least three repeats. (D, E, G, H) Data are shown as mean ± SEM. Survival curves were analyzed with logrank test along with Wang–Allison test for maximum lifespan. Asterisks indicate statistical significance (**P < 0.01) in single‐factor ANOVA with Scheffe's analysis as a post hoc test. Dashed lines mark time points of 50% survival.