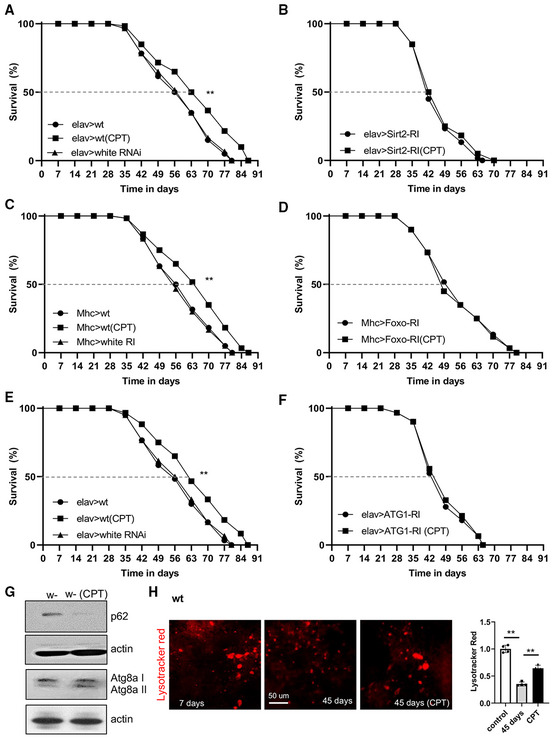
Figure 5. Lifespan effect of RET inhibition by CPT is mediated by Sirtuin, Foxo, and autophagy pathways.

-
A, BSurvival curves showing the effect of neuronal dSirt2 knockdown on fly lifespan under normal and CPT treatment conditions (n = 3 groups, 20–25 flies per group).
-
C, DSurvival curves showing the effect of muscle dFoxo knockdown on fly lifespan under normal and CPT treatment conditions (n = 3 groups, 20–25 flies per group).
-
E, FSurvival curves showing the effect of neuronal ATG1 knockdown on fly lifespan under normal and CPT treatment conditions (n = 3 groups, 20–25 flies per group).
-
GImmunoblots showing the effect of CPT on p62, ATG8a‐I, and ATG8a‐II levels in fly muscle.
-
HImages and data quantification in single‐factor ANOVA with Scheffe's analysis as a post hoc test showing lysotracker staining in the muscle of young flies, old flies, and old flies treated with CPT (n = 5 per group).
Data information: Data are representative of at least three repeats. Data are shown as mean ± SEM (H). Survival curves were analyzed with logrank test along with Wang–Allison test for maximum lifespan. Asterisks indicate statistical significance (**P < 0.01). Dashed lines mark time points of 50% survival.
