
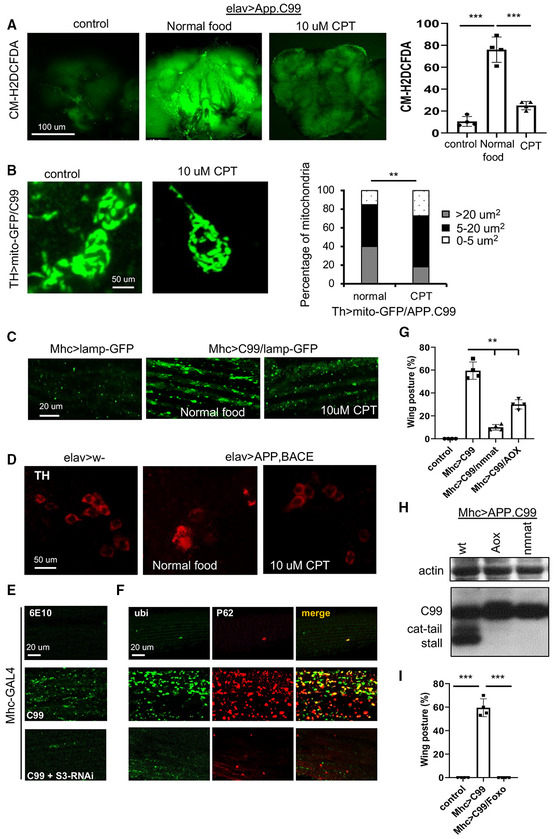
Figure EV5. Inhibition of RET rescues disease phenotypes of fly AD models.
-
AStaining images and data quantification showing the effect of CPT on ROS level in the brain of elav > APP.BACE flies (n = 3 set, 5 brains per set).
-
BImmunofluorescence images and data quantification showing the effect of CPT on mitochondrial morphology in DA neurons of TH > APP.C99 flies co‐expressing a mito‐GFP reporter (n = 5 brains per group).
-
CImmunofluorescence images showing the effect of CPT treatment on lysosomal morphology in the muscle of Mhc > APP.C99 flies.
-
DImmunofluorescence images showing the effect of CPT treatment on DA neuron number in the PPL1 cluster of elav > APP.BACE fly brain.
-
E, FImmunostaining showing the effect of NDUFS3‐RNAi on 6E10‐positive amyloid (E) and ubiquitin‐ and p62‐positive protein aggregates (F) in the muscle of Mhc > APP.C99 flies.
-
GQuantification of the effect of AOX or NMNAT overexpression on wing posture in Mhc > APP.C99 flies (n = 4 groups, 20 flies per group).
-
HImmunoblots showing the effect of AOX or NMNAT overexpression on aberrant APP.C99 translation products in Mhc > APP.C99 flies.
-
IQuantification of the effect of dFoxo overexpression on wing posture in Mhc > APP.C99 flies (n = 4 groups, 20 flies per group).
Data information: Data are representative of at least three repeats. Data are shown as mean ± SEM. Asterisks indicate statistical significance (***P < 0.001,**P < 0.01) using single=factor ANOVA with Scheffe's analysis as a post hoc test.