
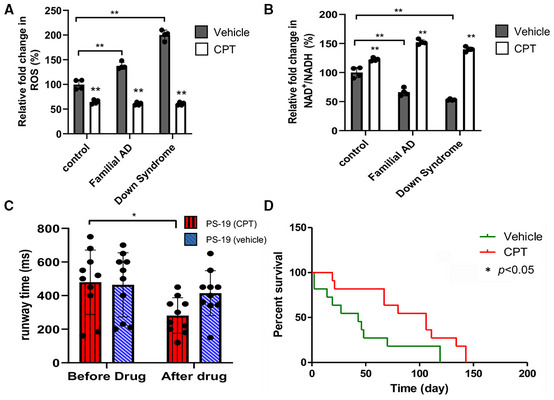
Figure 7. RET inhibition by CPT rescues disease phenotypes in mammalian AD models.
-
A, BQuantification of effect of CPT on ROS level as detected by staining with the H2O2 dye CM‐H2DCFDA (A), and on NAD+/NADH ratio (B) in control, FAD, and DS iPSC‐derived neurons.
-
CQuantification showing the effect of CPT on locomotor activity in PS19 tauopathy mice (n = 10 per group).
-
DSurvival curves showing the effect of CPT on lifespan of PS19 tauopathy mice (*P < 0.05 logrank) (n = 9 in vehicle group, 8 in CPT group).
Data information: Data are shown as mean ± SEM (C). Survival curves were analyzed with logrank test along with Wang–Allison test for maximum lifespan. Asterisks indicate statistical significance (**P < 0.01, *P < 0.05) in single‐factor ANOVA with Scheffe's analysis as a post hoc test (A–C).