
Figure 3.
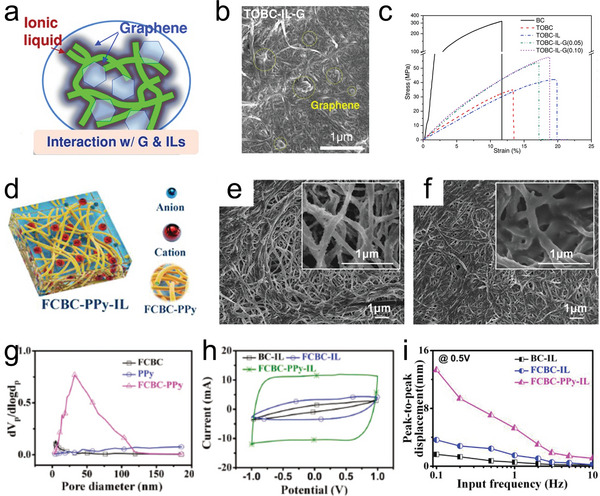
a) Schematic diagram of TOBC‐IL‐G. b) Scanning electron microscope (SEM) image of TOBC‐IL‐G. c) Tensile curves of BC and TOBC‐IL‐G composite membranes. d) Schematic diagram of the FCBC‐PPy‐IL ionically crosslinked nanocomposites. e) SEM image of FCBC‐PPy. f) SEM image of FCBC‐PPy‐IL. g) CV curves of the BC‐IL, FCBC‐IL, and FCBC‐PPy‐IL actuators based on PEDOT:PSS/DMSO electrodes under a scan rate of 100 mV s−1 in the potential window of +1.0 to −1.0 V. h) Specific capacitance values of the actuators under a scan rate of 100 mV s−1 in various potential windows. i) Peak‐to‐peak displacements of the actuators at frequencies ranging from 0.1 to 10 Hz under a sinusoidal input voltage of ±0.5 V at 0.1 Hz. a–c) Reproduced with permission.[ 64 ] Copyright 2015, John Wiley and Sons. d–i) Reproduced with permission.[ 66 ] Copyright 2020, John Wiley and Sons.