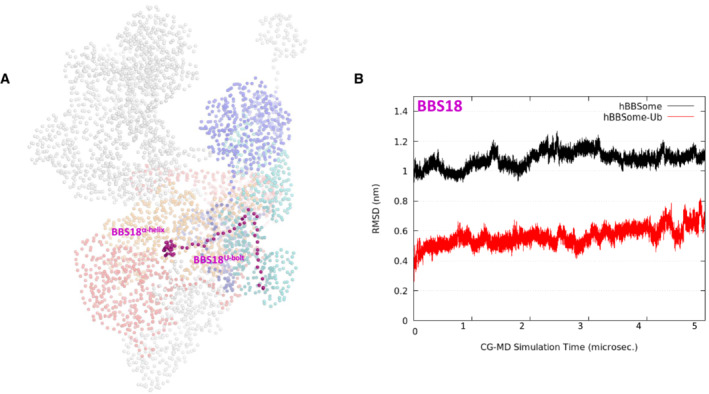
Figure EV3. Dynamic modeling of Ub‐hBBSome complex.

- CG beads of the Ub‐hBBSome model, highlighting the BBS18 subunit (magenta spheres).
- Root Mean Square Deviation (RMSD) of BBS18 subunit, highlighting the reduced mobility of hBBS18 residues in the K143 monoubiquitinated hBBSome (Ub‐hBBSome; red lines). RMSD calculations were performed on the CG‐MD production run considering only the BBSome beads (represented as spheres in panel A).
