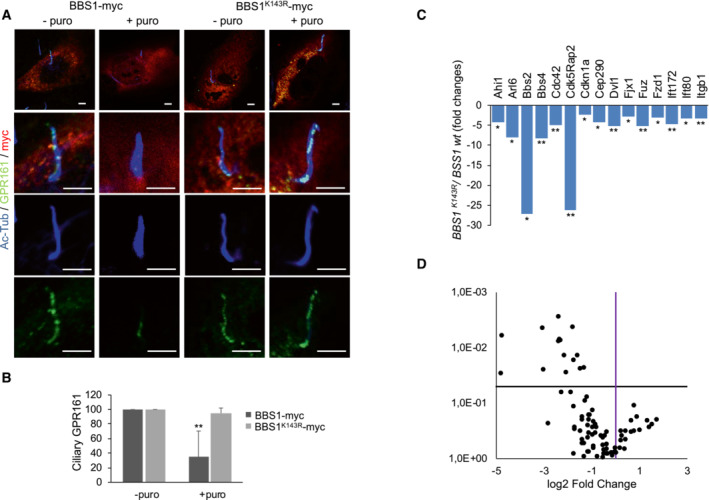
Figure 6. Expression of BBS1 K143R affects ciliary trafficking of GPR161 and Shh signaling.

- ARPE‐19 cells were transiently transfected with a vector for Myc‐tagged BBS1 variants, serum‐deprived for 48 h, and left untreated or stimulated with purmorphamine for 4 h. Cells were fixed and subjected to triple immunostaining analysis for GPR161 (green), acetylated tubulin (blue) and Myc (red). Scale bar, 3 μm.
- Cumulative data of the experiments shown in (A). A mean value ± S.D. of four independent experiments is shown. In total 25 cells for each experiment were scored. Student's t test, **P < 0.01.
- Expression of related primary cilium genes generated from Qiagen Rt2 profiler PCR array. Histogram shows the fold decrease of genes expressed in PJA2 silenced ARPE‐19 cells, compared to controls. It was generated using data from 3 independent experiments, and only the triplicates considered statistically significative (*P < 0.05; **P < 0.01) were included.
- Volcano plot of ciliary genes obtained from Qiagen RT2 profiler PCR array showing the distribution of genes expression compared with the threshold.
