Figure 1.

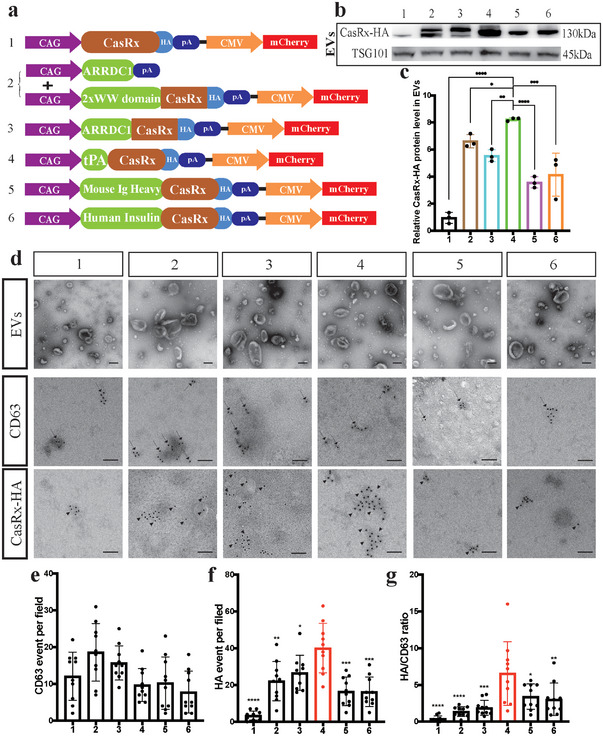
The tPA ligand improves protein loading into EVs. a) A schematic of the CasRx vector with different loading ligands. CasRx was labeled with an HA‐tag. b) Immunoblotting analysis comparing CasRx‐HA levels in EVs from different groups, TSG101 served as a control. c) Statistical analysis of the relative CasRx‐HA protein level in EVs. d) Morphological specificity of EVs examined using TEM (upper panel). Representative images of CD63 (middle panel) and CasRx‐HA (lower panel) staining in EVs from different groups obtained using IEM. Scale bar = 100 nm (upper panel) or 50 nm (middle and lower panels). e)Statistical analysis of CD63 counts per field (n = 10 wells per group). f) Statistical analysis of CasRx‐HA counts per field (n = 10 wells per group). g) Statistical analysis of the CasRx‐HA/CD63 ratio per field (n = 10 wells per group) showing that the tPA ligand group had the highest ratio of CasRx‐HA to CD63. ****p < 0.0001, ***p < 0.001, **p < 0.01, and *p < 0.05. The data are presented as the means ± SD.
