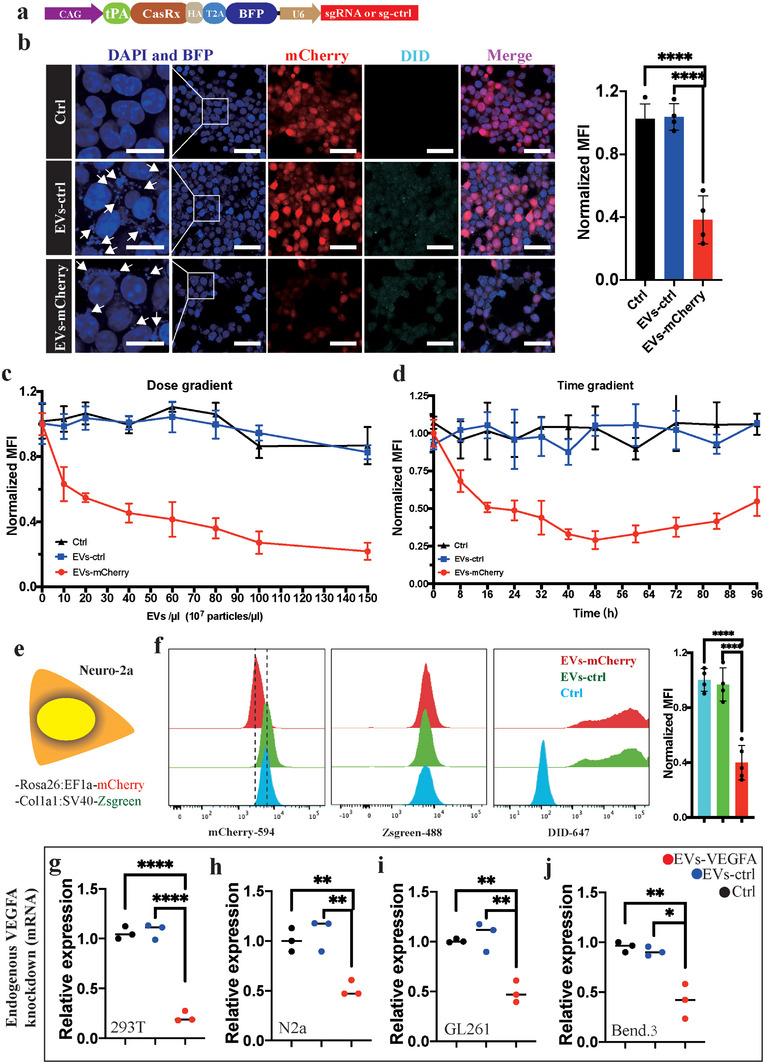
Figure 3.

The EVs‐CasRx/gRNA system inhibits exogenous and endogenous gene expression in vitro. a) Schematic illustrating the EV plasmid design. b) Immunostaining with DAPI, BFP, mCherry, and DiD shows that DiD‐labeled EVs‐mCherry entered the target cell, leading to decreased mCherry expression. The BFP in EVs was visualized in the target cell (white arrows) (left). Scale bars = 50 µm for the right and 20 µm for the left. Statistical analysis of mean fluorescence intensity (MFI) (right). c) The change in the mean fluorescence intensity after the administration of different numbers of EVs‐mCherry particles showed that the MFI decreased as the dose increased. d) Change in MFI over time showing that the MFI decreased within 48 h but gradually returned to the original level after 48 h. e) Schematic illustration of the Neuro‐2a cell line with double fluorescence staining. f) Distribution of Neuro‐2a cells in different spectral channels showing that the distribution of the EVs‐mCherry shifted to the left in channel 594. Moreover, the DiD dye labeling EVs was visible in channel 647 (left panel). Statistical analysis of MFI (right panel). g–j) Statistical analysis of VEGFA mRNA levels in 293T, N2a, GL261, and Bend.3 cell lines. ****p < 0.0001, ***p < 0.001, **p < 0.01, and *p < 0.05. The data are presented as the means ± SD.
