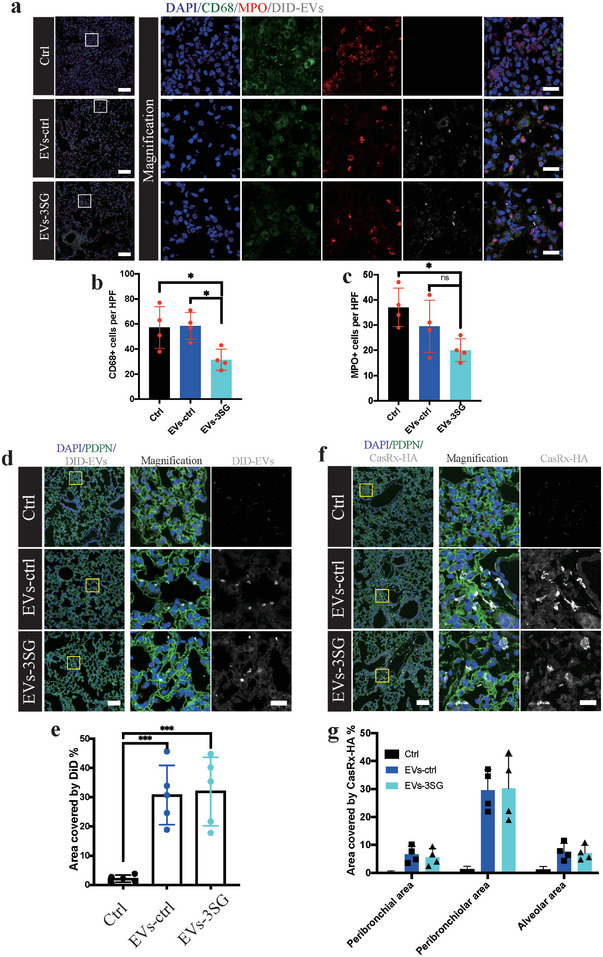
Figure 6.

Tracking of EVs in lung tissue. a) Immunostaining for DAPI, CD68, MPO and DID revealing that EVs entered inflammatory cells. Boxed regions are magnified on the right. Scale bar = 100 µm for the left images and 20 µm for the right images. b) Quantification of CD68+ cells per HPF. c) Quantification of MPO+ cells per HPF. d) Immunofluorescence staining of lung tissue from mice that received different treatments. Boxed regions are magnified in the right panel. Scale bar = 100 µm for the left images, 20 µm for the right images. e) Statistical analysis of the area stained with DiD in lung tissue. f) Representative immunofluorescence images showing that visible CasRx‐HA mainly clustered around the bronchioles. Boxed regions are magnified in the right panel. Scale bar = 100 µm for the left images and 20 µm for the right images. g) Statistical analysis of the distribution of CasRx‐HA in lung tissue. ****p < 0.0001, ***p < 0.001, **p < 0.01, and *p < 0.05. The data are presented as the means ± SD.
