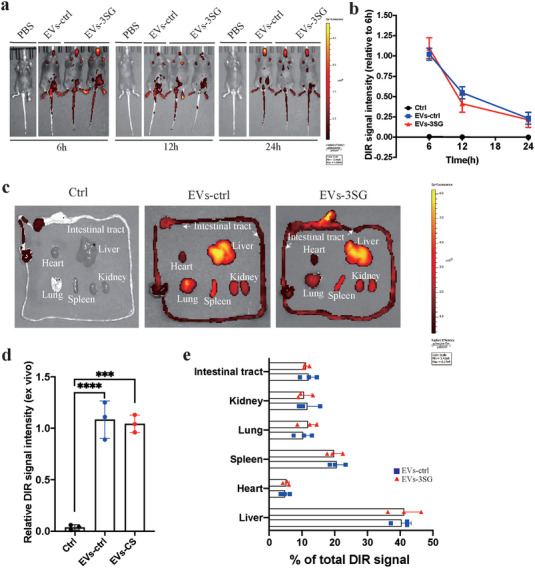
Figure 8.

Biodistribution of systemically infused EVs detected using DiR labeling. a) In vivo imaging of PBS or DIR‐EVs at 6, 12, and 24 h after an intraperitoneal infusion. b) Relative change in the DiR signal intensity over time with in vivo imaging. c) Different organs (heart, lung, kidney, liver, spleen, and intestinal tract) were collected 24 h after the infusion of DiR‐EVs for ex vivo imaging. d) Relative DiR signal intensity detected using ex vivo imaging. e) Absolute DiR signal intensity in different organs of mice that received EVs‐ctrl and EVs‐3SG treatment. ****p < 0.0001, ***p < 0.001, **p < 0.01, and *p < 0.05. The data are presented as the means ± SD.
