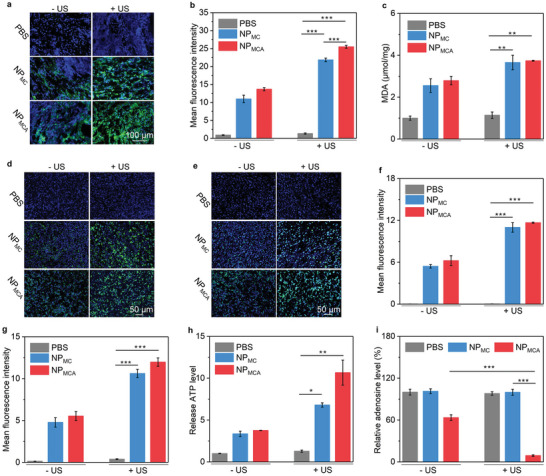
Figure 6.

Intratumoral lipid peroxidation and ICD evaluation. a) Fluorescence images of produced ROS in chicken breast tissue‐covered primary tumors in PBS‐, NPMC‐ and NPMCA‐treated mice without or with US treatment. b) Mean fluorescence intensity of the produced ROS in chicken breast tissue‐covered primary tumors (n = 5). c) Lipid peroxidation assay of chicken breast tissue‐covered primary tumors in these treatment groups (n = 5). d) Immunofluorescence CRT staining images of chicken breast tissue‐covered primary tumors. e) Immunofluorescence HMGB1 staining images of chicken breast tissue‐covered primary tumors. f) Relative fluorescence intensity of CRT in tumors after different treatments (n = 5). g) Relative fluorescence intensity of HMGB1 in tumors after different treatments (n = 5). h) Relative ATP levels in chicken breast tissue‐covered primary tumors in these treatment groups (n = 5). i) Relative adenosine levels in chicken breast tissue‐covered primary tumors (n = 5). The data are presented as the means ± SDs. The p values are calculated using two‐tailed unpaired t test, *p < 0.05, **p < 0.01, and ***p < 0.001.
