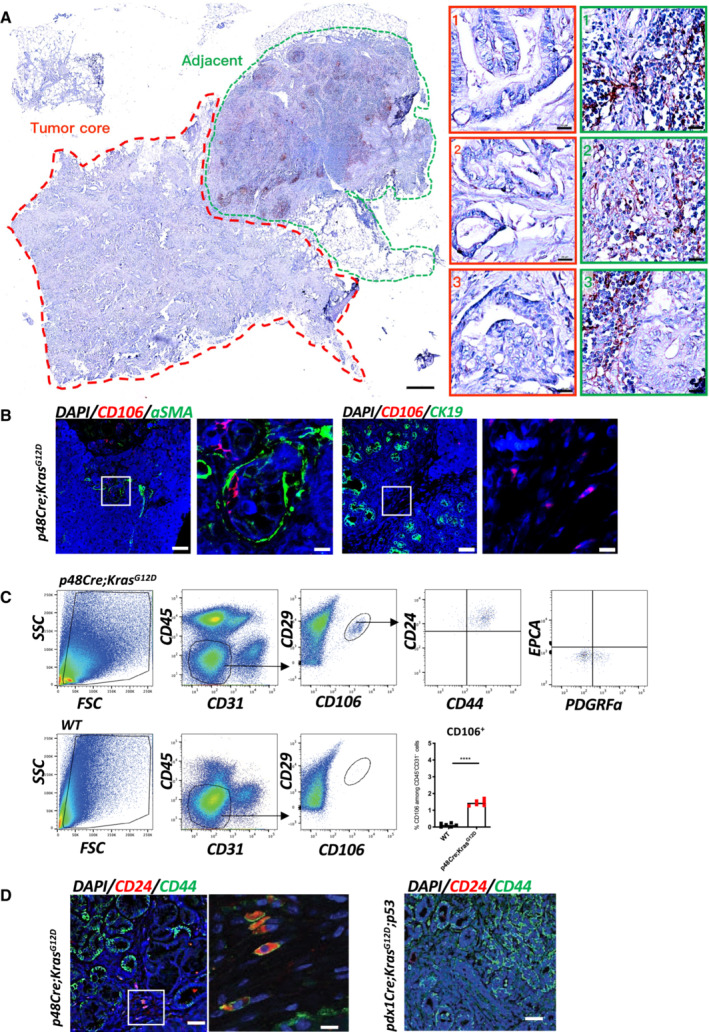
Figure 1. The CD106+ population is uniquely localized in pancreatic injury and precancerous lesions.

- Representative IHC staining of tumor core and adjacent region in PDAC patient (stage II) for CD106+. The corresponding magnification insets of the tumor core (red dotted line) or adjacent region (green dotted line) are displayed on the right. Scale bar, 500 μm in gross, 20 μm in magnification.
- Immunofluorescence staining of the pancreas obtained from a 2.5‐month‐old KC mouse for CD106 (red), α‐SMA (green) or CK19 (green), and DAPI (blue). Scale bar, 50 μm, 10 μm.
- Gating strategy for the identification of the CD106+CD24+CD44+ population in KC and WT mice. FACS analysis of the percentage of CD106+ among CD45−CD31− cells; each dot represents one mouse. The bars are representing the mean. The P‐values were calculated using Student's t‐test.
- Immunofluorescence staining of pancreases obtained from a KC mouse (left) and a 2.5‐month‐old KPC mouse (right) for CD44 (green), CD24 (red), and DAPI (blue). Scale bar, 50, 10 μm.
Source data are available online for this figure.
