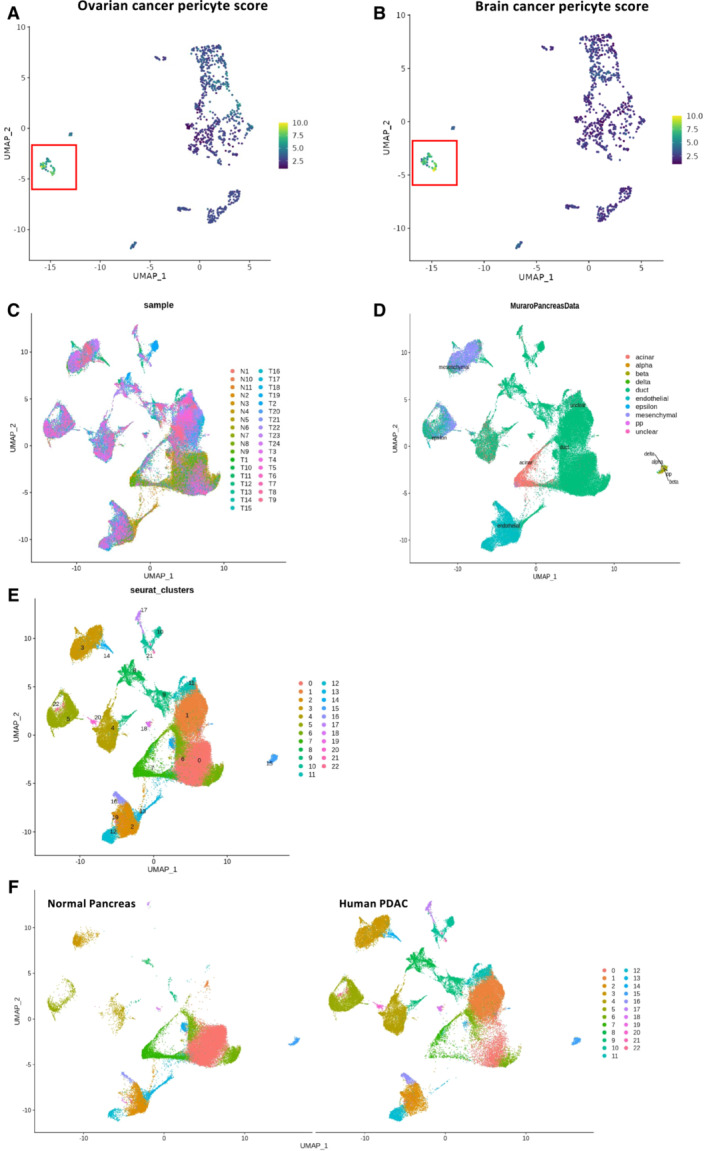
Figure EV2. PeSC signature in human cancer single‐cell data.

-
A, BApplication of ovarian cancer pericyte (A) and brain cancer pericyte score (B) to our mouse single‐cell RNAseq analysis showing enrichment in the unique cluster of PeSC.
-
CPooled single‐cell RNAseq data to UMAP analysis from 35 samples (11 normal pancreas and 24 PDAC patients), including a total number of over 80,000 cells. The UMAP shows the distribution of each cell cluster.
-
DCell types of each cluster were identified based on Muraro's single‐cell dataset as a reference.
-
E, FUnsupervised clustering UMAP analysis distinguishes 23 subclusters in the integration of whole 35 samples (E), pooled from 11 normal pancreas samples and 24 PDAC samples (F).
