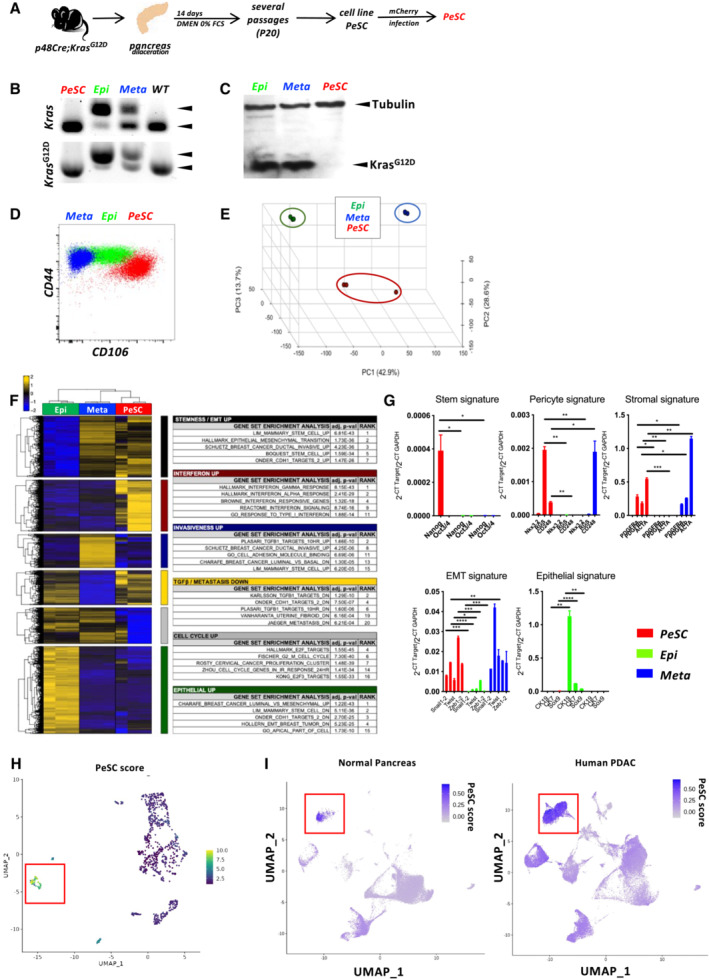
Figure 3. The CD106+ population shares pericyte, stem cell and stromal features.

- Schematic representation of the experimental setting for PeSC line generation.
- PCR for genomic Kras and KrasG12D.
- Western Blot analysis for tubulin and mutated KrasG12D proteins in total proteins extracts of PeSC, Epi, and Meta cells.
- Representative dot plot of the CD44 and CD24 staining of PeSCs and Epi and Meta cells.
- Principal component analysis (PCA) of RNA‐seq data from the indicated cell populations (n = 3).
- Pathway enrichment of a list of genes.
- qPCR analysis of several genes identified in the RNAseq analysis. Treatment was performed in biological triplicates and qPCR analysis was performed by technical duplicates. The bars are representing the mean ± SD. *P < 0.05, **P < 0.01, ***P < 0.001, and ****P < 0.0001. The P‐values were calculated using Student's t‐test.
- Definition of the PeSC score (bulk RNAseq) applied to the single‐cell RNAseq analysis and identification of cluster 7.
- Application of PeSC score to the human PDAC public single‐cell RNAseq database and identification of a cluster with the highest PeSC (red square) among the mesenchymal population (Fig EV2D) in either Normal Pancreas (left) or Human PDAC (right).
Source data are available online for this figure.
