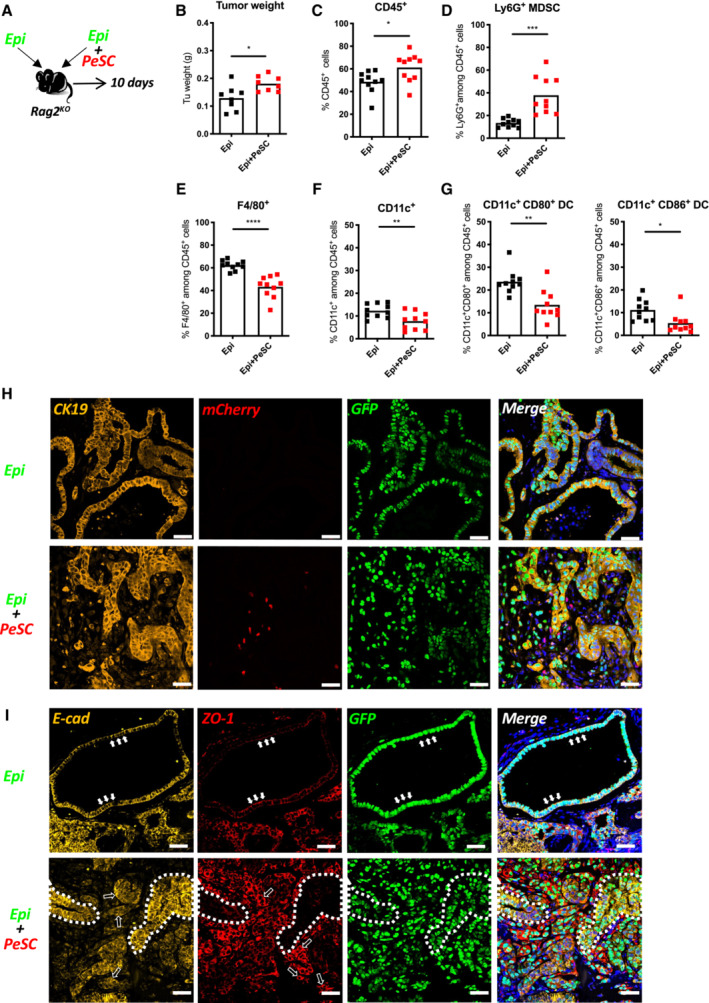
Figure 5. In vivo injection of PeSCs in the context of epithelial tumors induce Ly6G+ MDSCs in the microenvironment.

-
AExperimental setting.
-
B–G(B) Tumor weight. FACS analysis of the percentages of CD45+ cells (C), Ly6G+CD45+ MDSCs (D), F4/80+CD45+ Macrophages (E), CD11c+CD45+ DCs (F), and CD11c+CD80+/CD11c+CD86+ DCs (G). The results shown are cumulative from three independent experiments (each dot represents one mouse, 12–15 mice per group).
-
H, IRepresentative immunofluorescence staining of implanted tumors in Rag2KO mice for CK19, mCherry, GFP and DAPI (H) and E‐cadherin, ZO‐1 and GFP (I). Solid white arrows indicated the representative cells which expressed E‐cadherin and ZO‐1 in the cell junctions. Hollow white arrows indicated the representative cells whose E‐cadherin or ZO‐1 expression was shifting to the cytoplasm. The white dotted line indicated two representative areas where E‐cadherin and ZO‐1 were reversely expressed. Scale bar, 50 mm. *P < 0.05, **P < 0.01 and ***P < 0.001. The P‐values were calculated using Student's t‐test.
Source data are available online for this figure.
