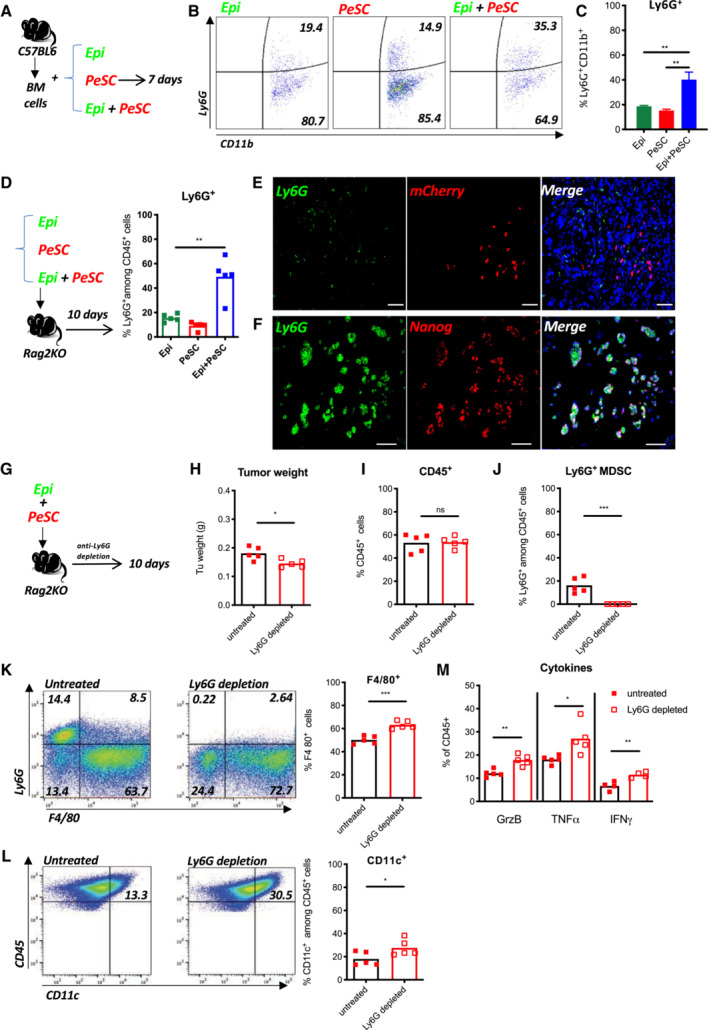
Figure 6. Tumor‐PeSCs crosstalk induces Ly6G+ MDSC differentiation.

-
AExperimental setting of bone marrow differentiation.
-
BRepresentative dot plots of CD11b and Ly6G staining in bone marrow cells cultured in the presence of Epi cells, PeSCs or both Epi cells, and PeSCs.
-
CQuantification of the percentage of Ly6G+ cells among CD11b+ cells (cumulative from three independent experiments). The bars are representing the mean ± SD.
-
DExperimental setting for in vivo injection. FACS analysis of the percentages of Ly6G+CD45+ cells (each dot represents one mouse per group).
-
E, FRepresentative immunofluorescence staining of coimplanted Epi cells + PeSCs for Ly6G, mCherry, Nanog, and DAPI. Scale bar, 50 mm.
-
G–MIn vivo depletion of Ly6G+ MDSCs diminishes tumor growth. (G) Experimental setting. (H) Tumor weight. FACS analysis of the percentage of CD45+ cells (I), and Ly6G+ MDSCs (J) derived from the tumor. (K) Representative dot plots of Ly6G‐ and F4/80‐stained CD45+ cells. FACS analysis of the percentage of F4/80+ cells. (L) Representative dot plots of CD45‐ and CD11c‐stained cells. FACS analysis of the percentage of CD11c+ cells among CD45+ cells. (M) FACS analysis of GrzB+, TNFα+, and IFNγ+ cells among CD45+ cells. Eight mice in each group, five for FACS analysis and three for histological analysis. Each dot represents one mouse.
Data information: *P < 0.05, **P < 0.01, and ***P < 0.001. The P‐values were calculated using Student's t‐test.
Source data are available online for this figure.
