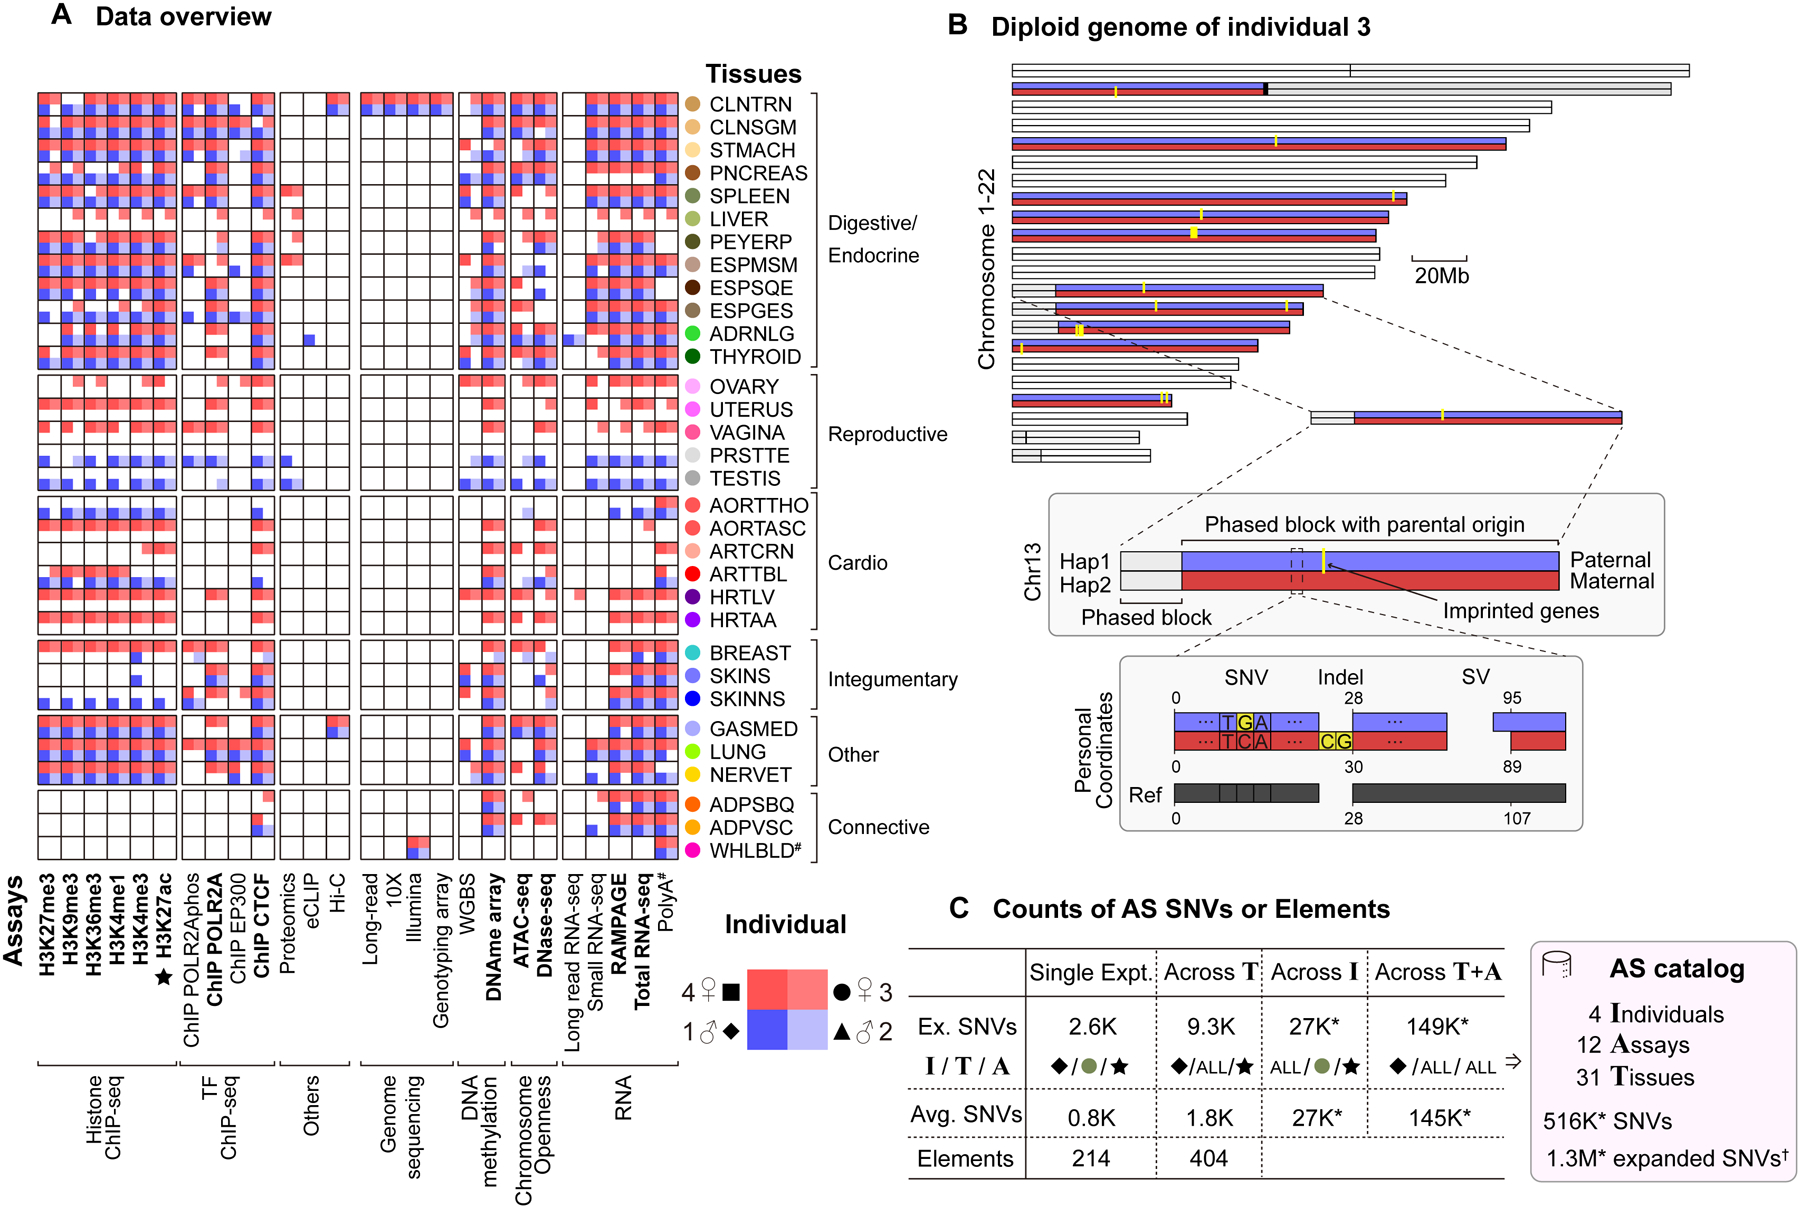
Figure 1. Uniform Multi-tissue Data Collection, Diploid Mapping and Construction of the AS Catalog.

(A) Data matrix. The 13 core assays are indicated in bold; tissue colors from GTEx. (Details in Figure S1A.)
(B) The personal diploid genome of individual 3. The chromosomes are phased with known imprinting events (yellow), allowing the maternal (red) or paternal (blue) origin of many of the phased blocks to be identified. A schematic diagram of a region in chr13 shows the differences between the personal diploid genome and the reference genome, in particular their different coordinate systems and sequences. (Details in Data S2G and STAR Methods “Personal Genome” Section.)
(C) The AS catalog. Key statistics are shown at each level of pooling and averaging. By aggregating across tissues, individuals or assays, we were able to identify a large number of AS SNVs and AS genomic elements, resulting in an AS catalog. “*” indicates the aggregation was done by pooling of reads, instead of the default union method, which significantly increased detection power. Representative numbers in the “Ex. SNVs” row are initially based on a specific H3K27ac experiment in the spleen of individual 1. The I/T/A row shows whether this choice is continued in subsequent columns or whether averaging or pooling is done over “ALL” the individuals, tissues, or assays, respectively. “†” indicates AS SNVs from DNase and WGBS in addition to the 12 RNA/ChIP/ATAC assays. (Details in Figure S3A–D and STAR Methods “AS Catalog” Section.)
